
I’ve spent the last couple of weeks reviewing dozens of project management dashboards to see what project managers actually use day-to-day. Here are 10 examples of the main dashboards PMs use, why they matter, and the best tools to quickly build your own in 2026.
What is a project management dashboard?
A project management dashboard is a visual tool that pulls together key project data like tasks, timelines, budgets, and team workload into one central view.
Usually, information lives in different places. It might be in your task tracker, your spreadsheet, calendar, someone's email, and Slack. A project management dashboard pulls all of that into one screen. So instead of piecing together status updates from scattered sources, you see the current state of your work at a glance.
Most project dashboards have:
- Status indicators: Color-coded signals (red, yellow, green) that show project health.
- Progress tracking: Visual representations of completion percentages, milestone achievements, and timeline adherence. This might appear as bar charts or progress rings.
- Key performance indicators (KPIs): The specific metrics that matter for your project type. For software teams, that might be deployment frequency. For agencies, it could be billable utilization.
- Resource visibility: Who's working on what, who's overloaded, and who has capacity. This prevents the all-too-common problem of burning out your best people while others sit underutilized.
- Financial tracking: Budget vs actual spending, cost forecasts, and profitability metrics.
10 Examples of Project Management Dashboards
Here's how teams put these elements together for different purposes.
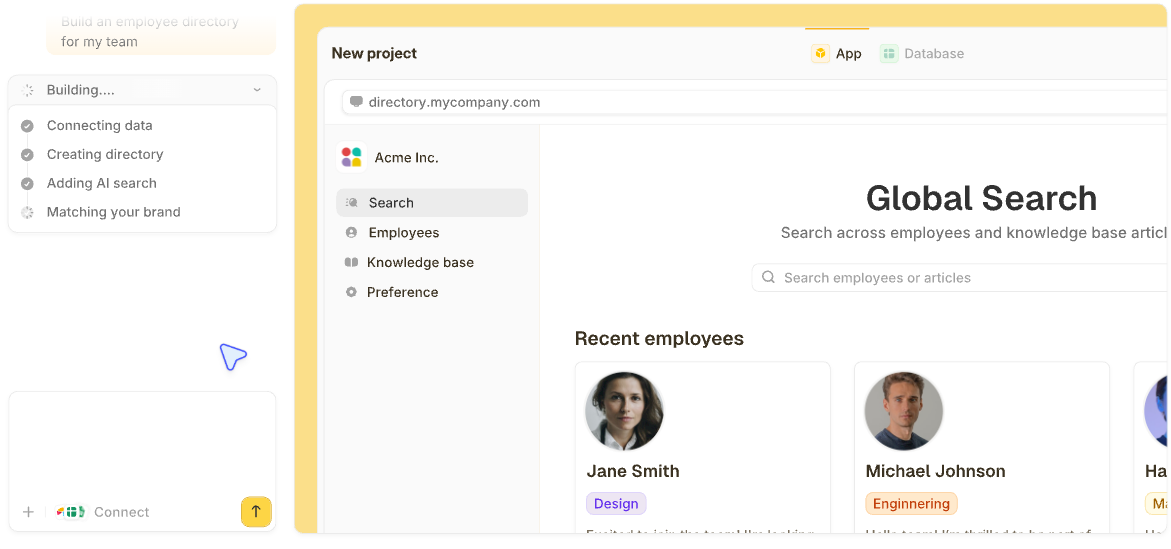
Note: I’ve used Zite to generate these examples and covered its functionality more deeply in the tools section below.
- Portfolio overview dashboard
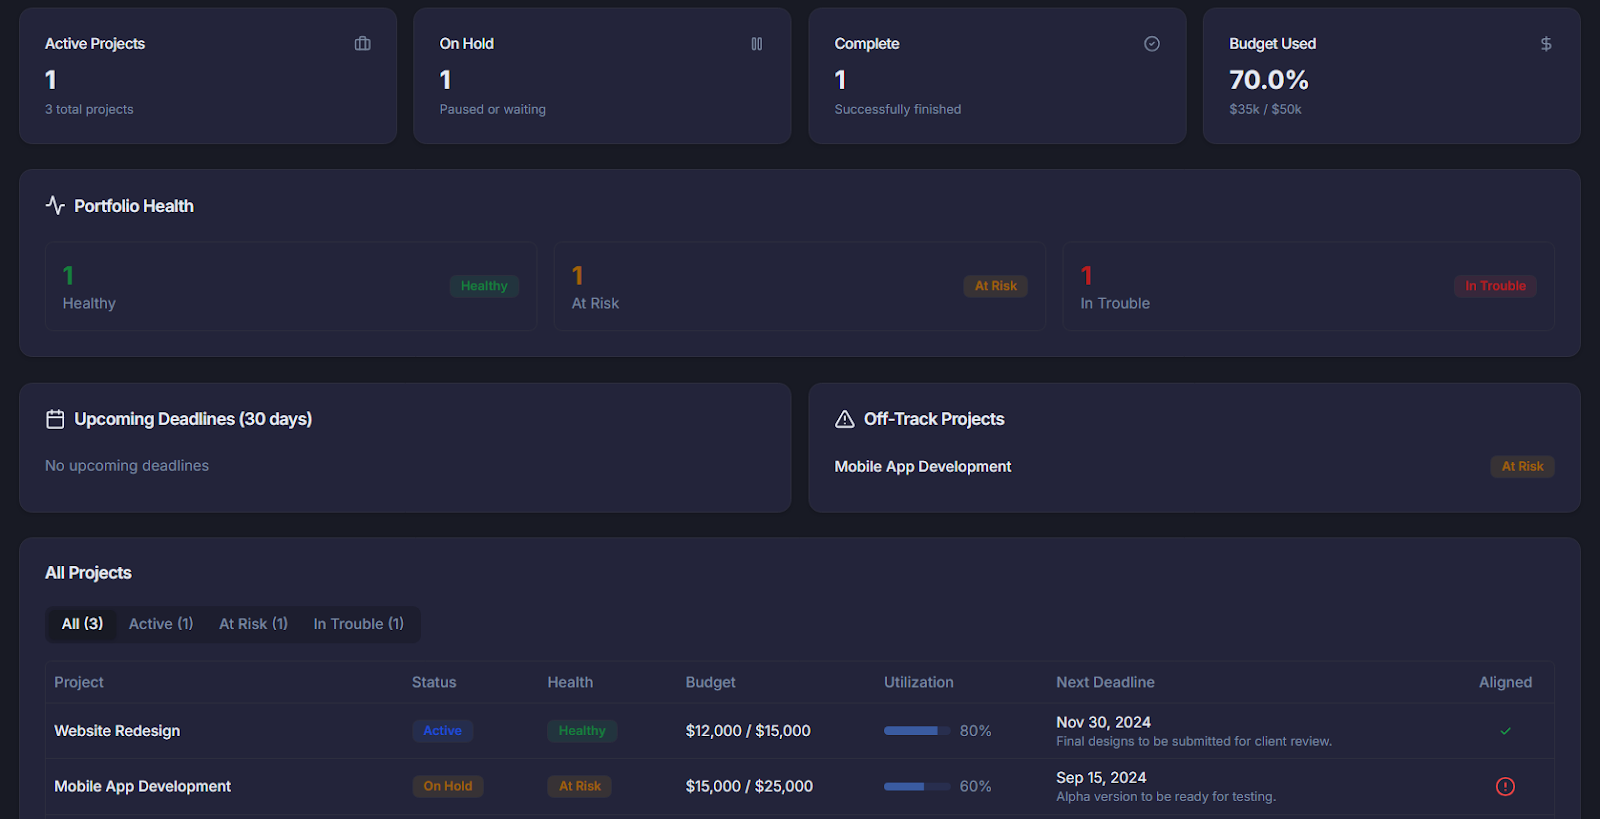
A portfolio overview dashboard gives you the bird's-eye view of every project you’re managing. Rather than clicking into each project individually, you see status summaries, budget positions, and risk flags across your entire portfolio on one screen.
Key metrics to include:
- How many projects are active, on hold, or complete
- Which projects are healthy, at risk, or in trouble
- How much budget has been used across all projects
- Big deadlines coming up in the next few weeks
- Any projects that are off track from the company's goals
Why it matters: When you manage 15+ projects, you can't possibly track each one in detail, but you can watch for red flags that need your attention.
- Demand management dashboard
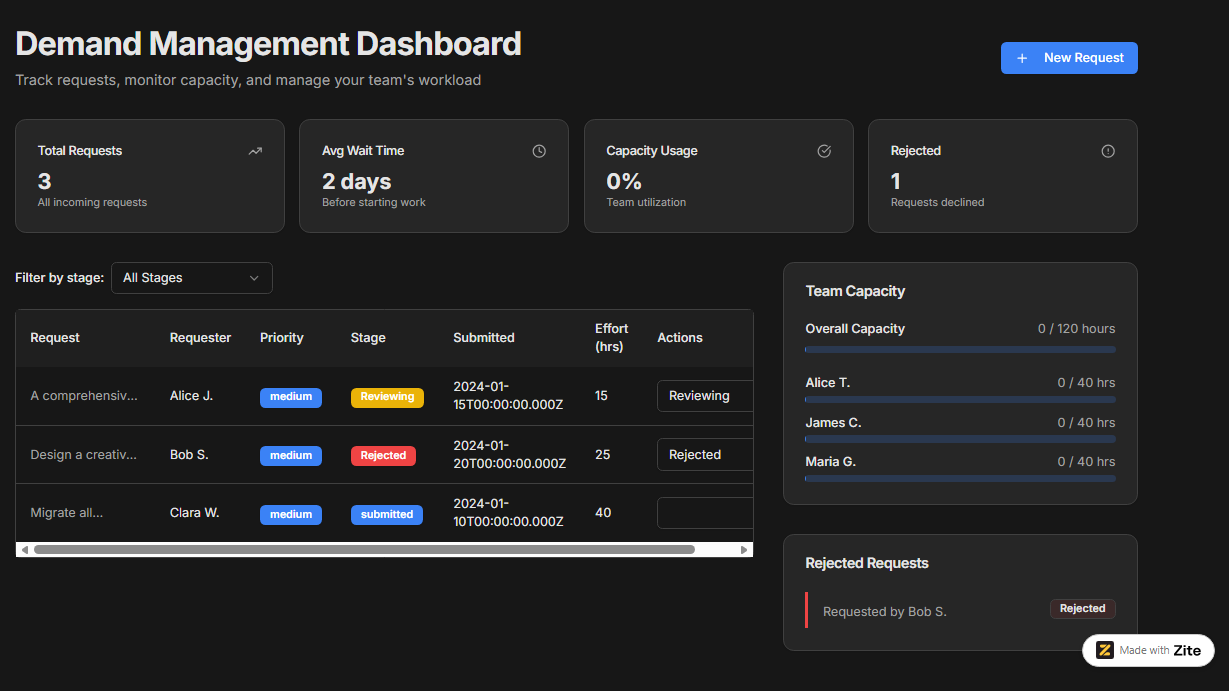
A demand management dashboard captures every incoming request in one queue. You can see what's been submitted, what's being evaluated, what's been approved, and what's waiting for someone to start working on it.
More importantly, you can compare the volume of requests against your actual capacity to deliver.
Key metrics to include:
- All incoming requests in one list
- What stage each request is in (submitted, reviewing, approved, and in progress)
- How long requests typically wait before starting
- Whether you have enough people to handle everything in the queue
- Requests that were turned down and why
Why it matters: If you don’t manage incoming work, you might say yes to too many small or low-priority requests. Meanwhile, the work that actually moves the business forward gets stuck waiting. Demand management makes those tradeoffs visible.
- Resource management dashboard
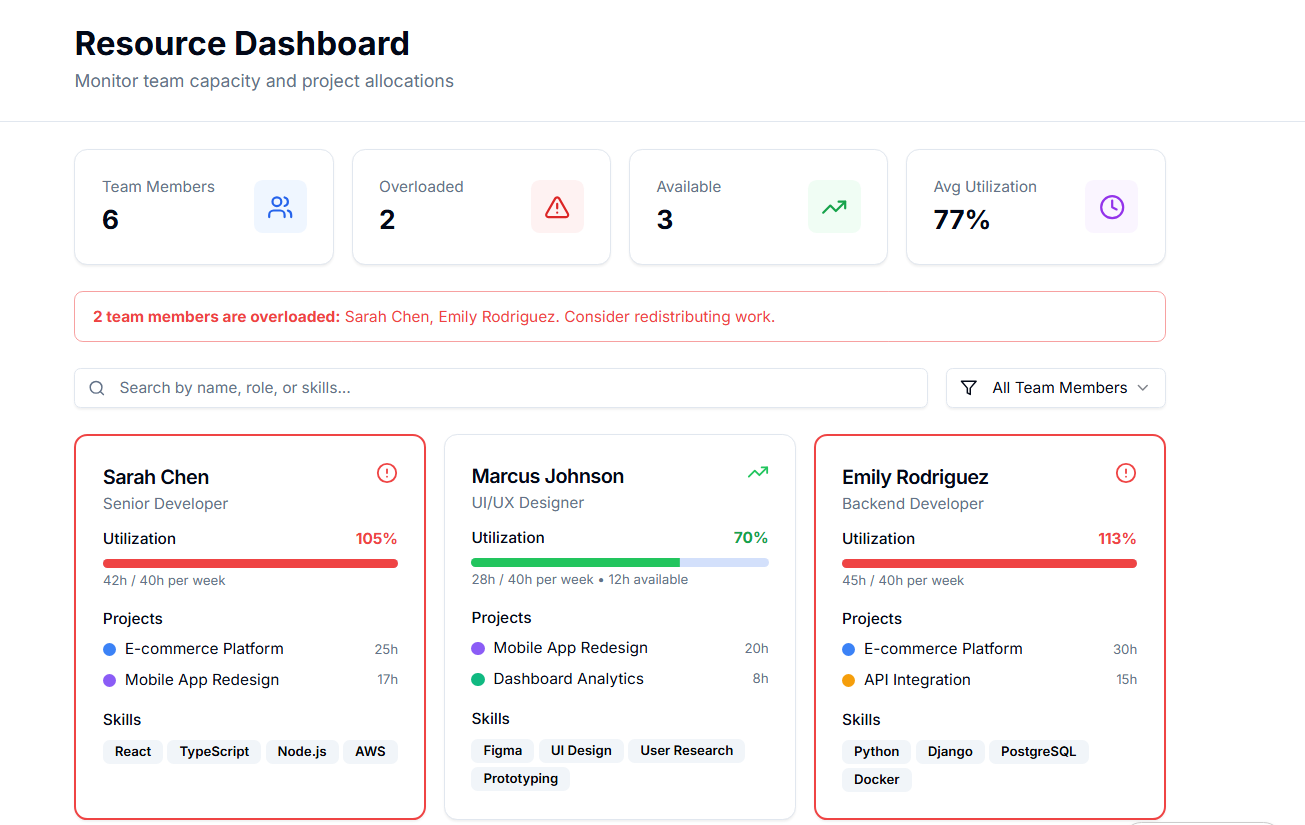
A resource dashboard shows who's doing what and how much room they have for more. Instead of finding out someone is overloaded after they miss deadlines or burn out, you can spot the problem early and shift work around.
Key metrics to include:
- How busy each person is (shown as a percentage or simple visual)
- What projects each person is working on
- Who has room for more work in the coming weeks
- Alerts when someone is assigned too much
- What skills each team member has
Why it matters: When team members burn out, you risk delays and low-quality deliverables. A resource dashboard helps you assign work that keeps people productive without pushing them over the edge.
- Engineering delivery dashboard
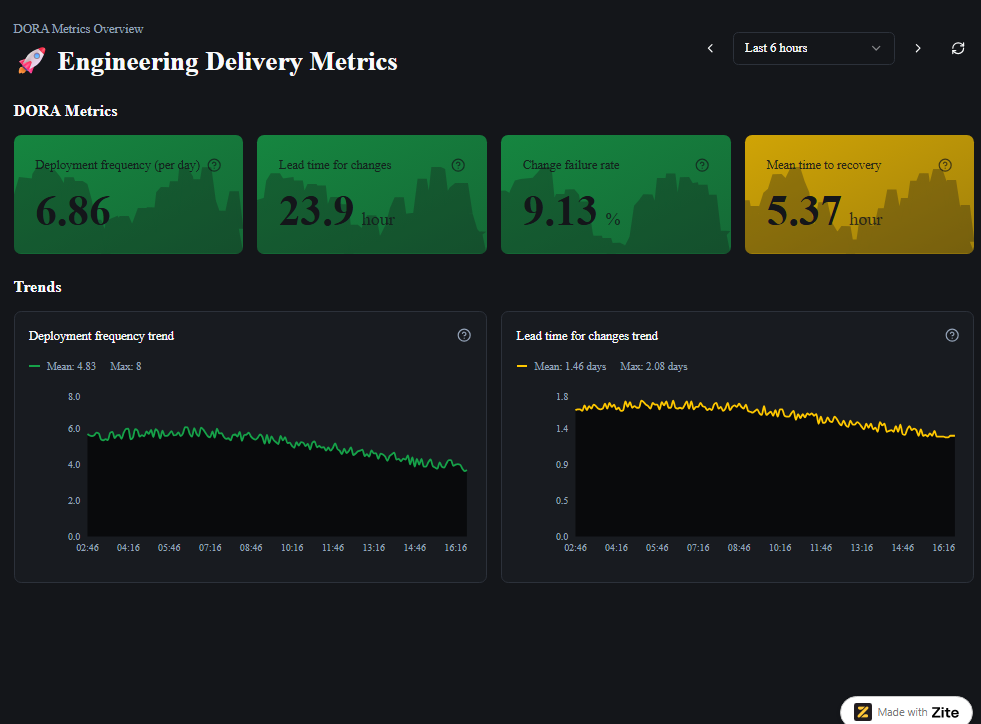
An engineering delivery dashboard is a live scoreboard that shows how effectively your engineering team is shipping software over time. It connects to tools like Git, CI/CD, and issue trackers, and visualizes whether the team is delivering the right work at the right pace.
Key metrics to include:
- Deployment frequency (how often you ship)
- Lead time (how long work takes from idea to production)
- Quality signals (bug rates, incident counts, and change failure rate)
- Mean time to recovery (how fast you fix incidents)
- How much planned work gets completed each cycle
Why it matters: You can ship updates more often, recover from incidents faster, and reduce the number of changes that cause problems in production.
- Task-centric execution dashboard
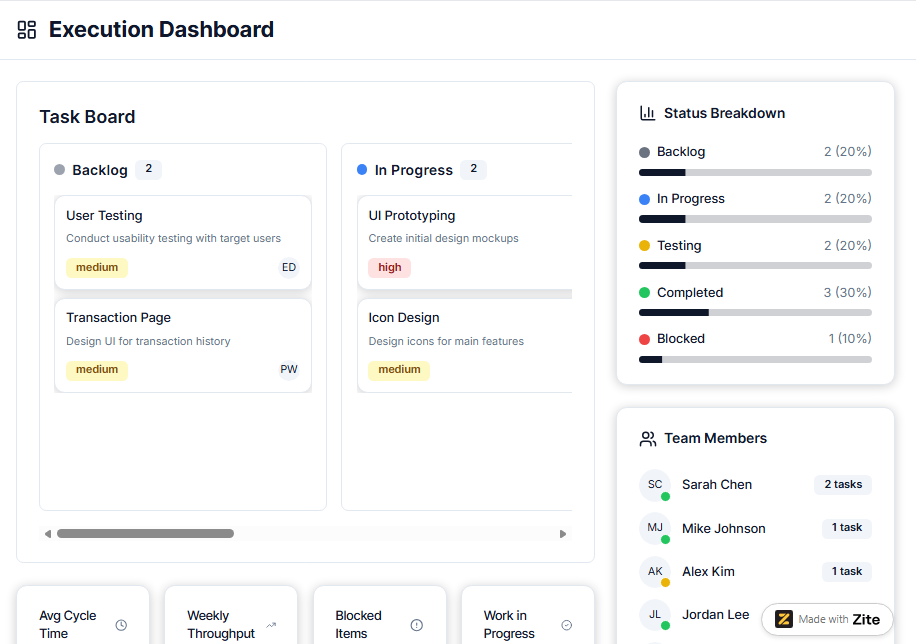
An execution dashboard is a visual tool that shows how tasks move through your workflow. It organizes work into columns like backlog, in progress, testing, and completed, so everyone can see exactly where each task sits.
Key metrics to include:
- Tasks by status (backlog, in progress, blocked, and complete)
- Work-in-progress (WIP) limits by column
- Cycle time (how long tasks spend in each stage)
- Throughput (tasks completed per week)
- Blocked items requiring attention
Why it matters: These dashboards make it easy to check how a project is going and spot any slowdowns. If cards start stacking up in one column, you can clearly see where the work is getting stuck.
- Release planner dashboard
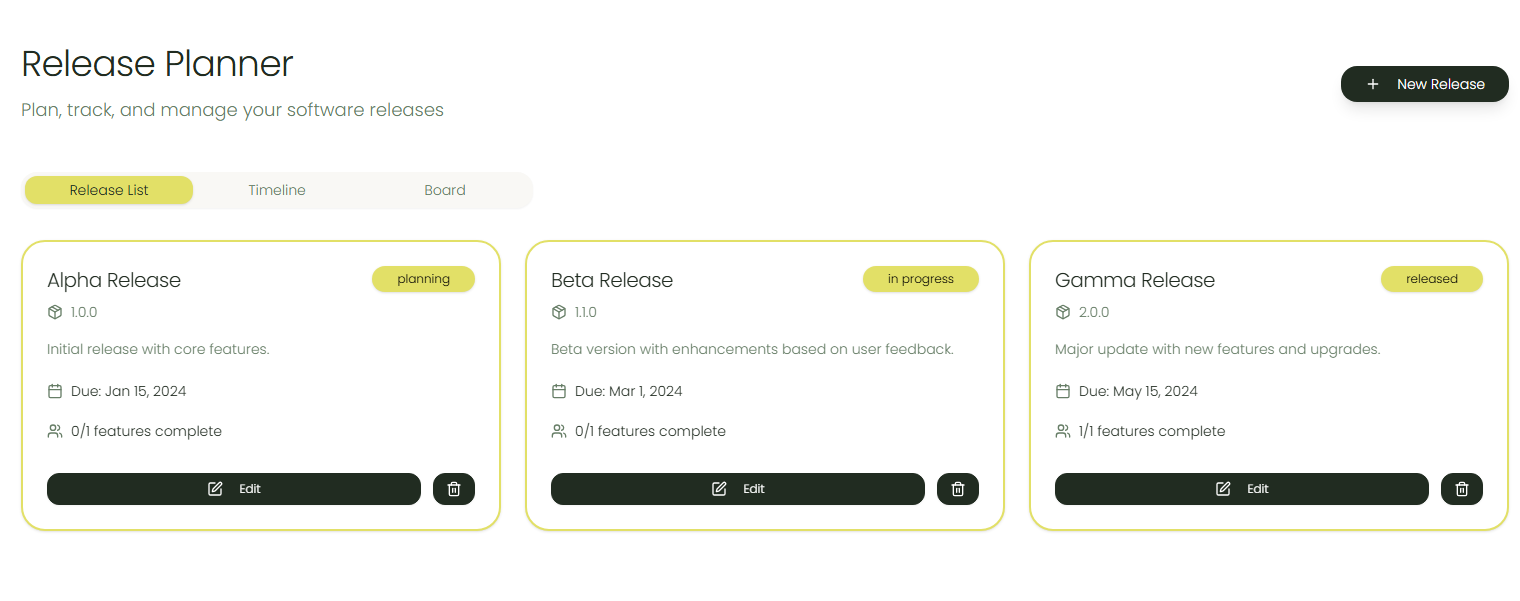
A release planner dashboard is a live schedule of all upcoming product or project releases, showing exactly what is shipping, when it will ship, and how ready it is.
Zite has a ready-made template built for managing releases. You can use it as it is or clone it and customize it.
Key metrics to include:
- Upcoming releases and planned launch dates
- Features, tickets, or epics included in each release
- Current readiness status (on track, at risk, and blocked)
- Critical dependencies and owners
Why it matters: It shows exactly what’s shipping when and who is responsible so you can adjust scope early, and hit release dates on time.
- Financial project dashboard
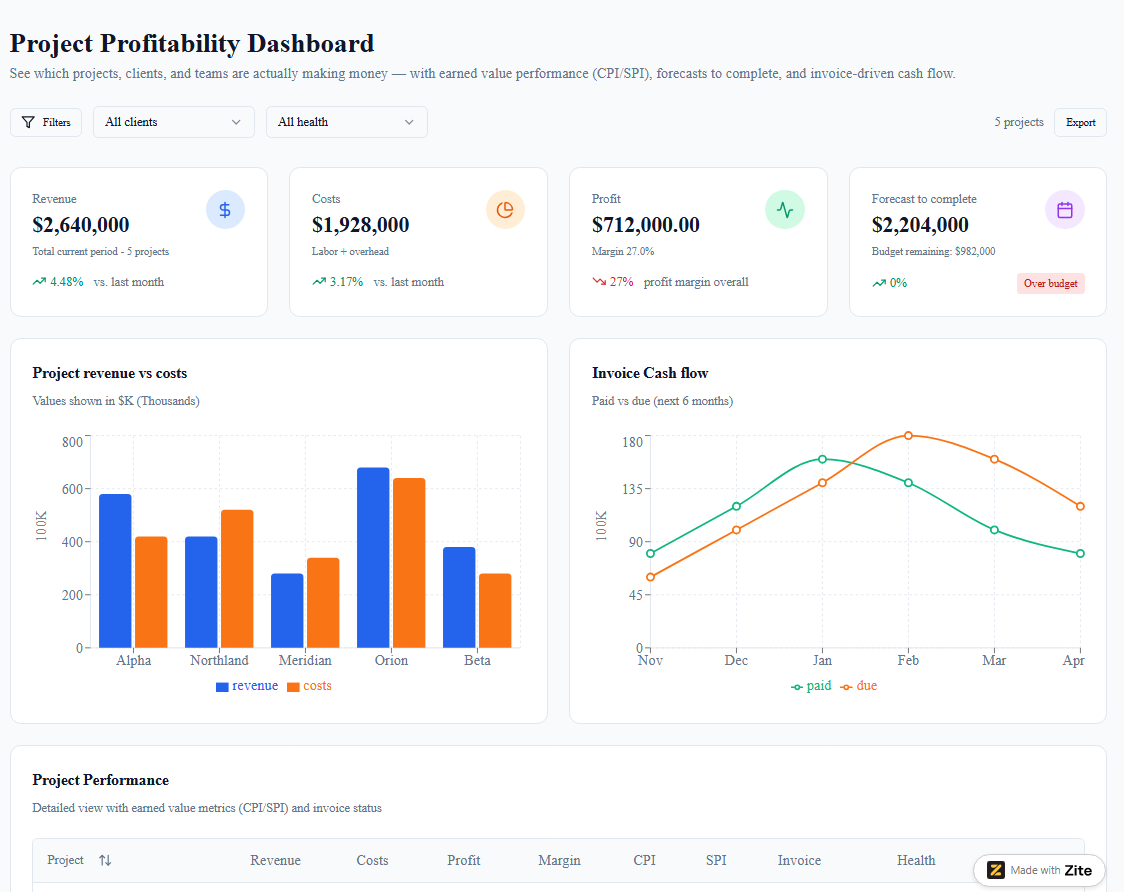
Financial project dashboards go beyond simple budget tracking to show whether projects are actually making money. They connect revenue, costs, margins, and forecasts into a unified financial view.
Key metrics to include:
- Project revenue vs costs
- Profit margin by project and client
- Earned value metrics (CPI, SPI)
- Forecast to complete vs budget remaining
- Invoice status and cash flow
Why it matters: If you don’t track profitability, it's easy to fall into a trap of pursuing high-revenue projects while overlooking work with better margins.
- Budget vs actual dashboard
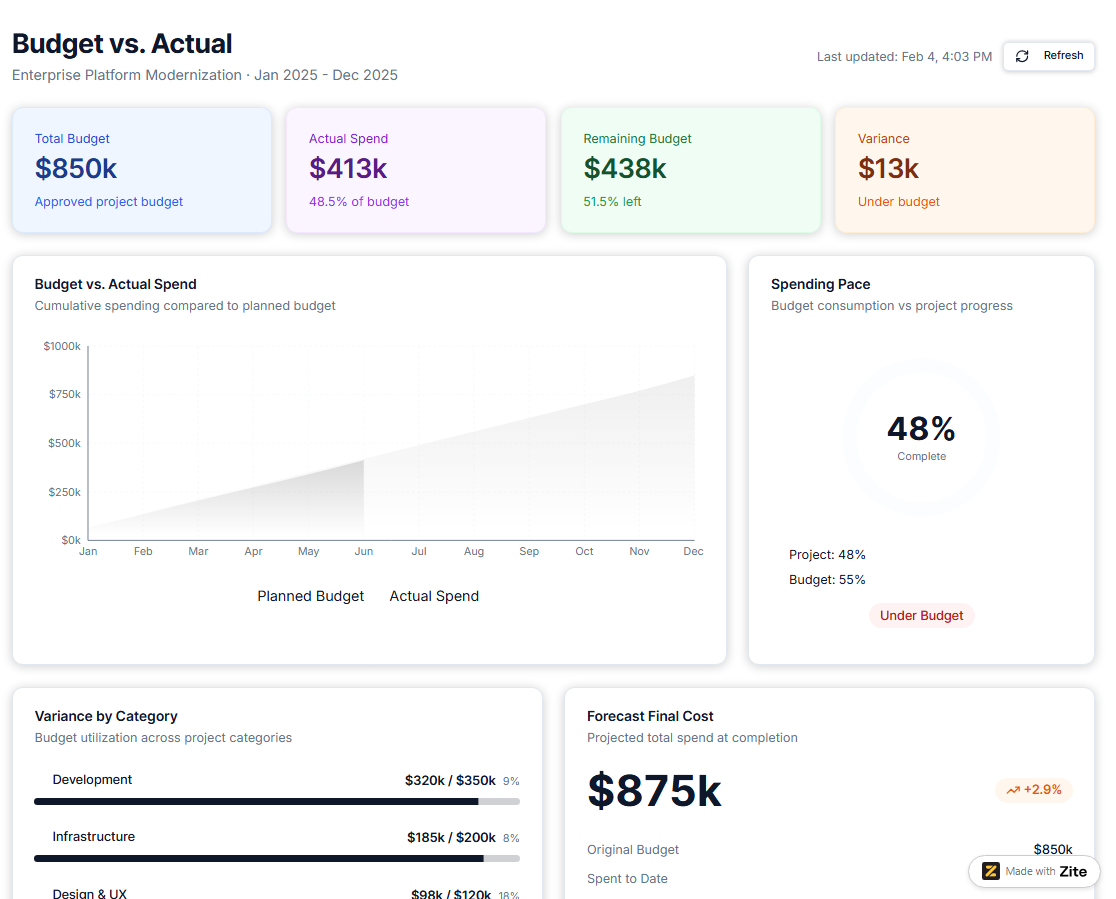
A budget vs actual dashboard shows the difference between what you planned to spend and what you have actually spent so far on a project. It makes it easy to see if a project is staying on budget and if it might go over before the work is finished.
Key metrics to include:
- Planned budget vs actual spend (cumulative)
- Variance by budget category
- Spending pace compared to project completion
- Forecast final cost
- Cost trend over time
Why it matters: They show, in real time, if your project is staying on budget or starting to go over, so you can adjust.
- Project timeline dashboard
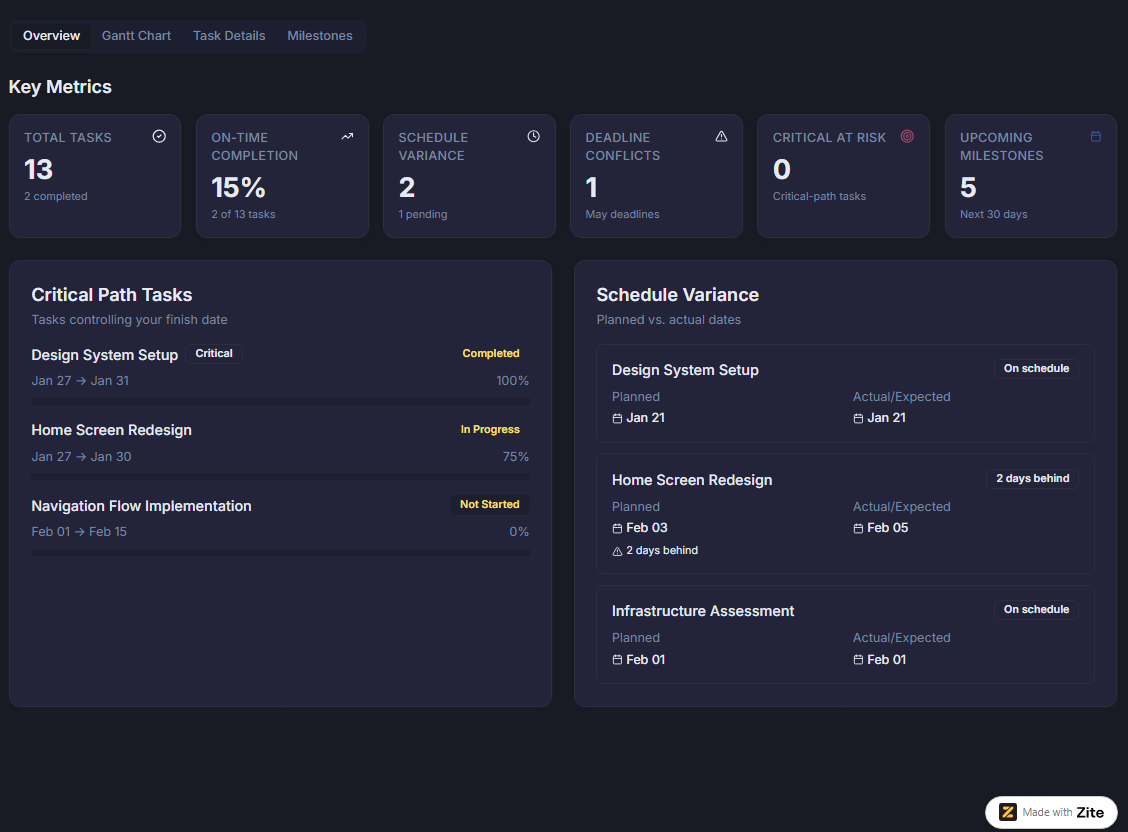
A project timeline dashboard shows your schedule as a visual roadmap or Gantt chart so you can see how work fits together over time. It makes it clear how tasks connect, where they overlap, and whether you are on track to hit key dates.
Key metrics to include:
- Milestone status (upcoming, on track, at risk, or complete)
- Tasks that directly control your finish date
- Schedule variance (planned vs actual dates)
- Deadline conflicts across projects
- Percentage of tasks completed on time
Why it matters: You can quickly see where delays are forming and identify roadblocks before they derail important deliverables.
- Project utilization dashboard
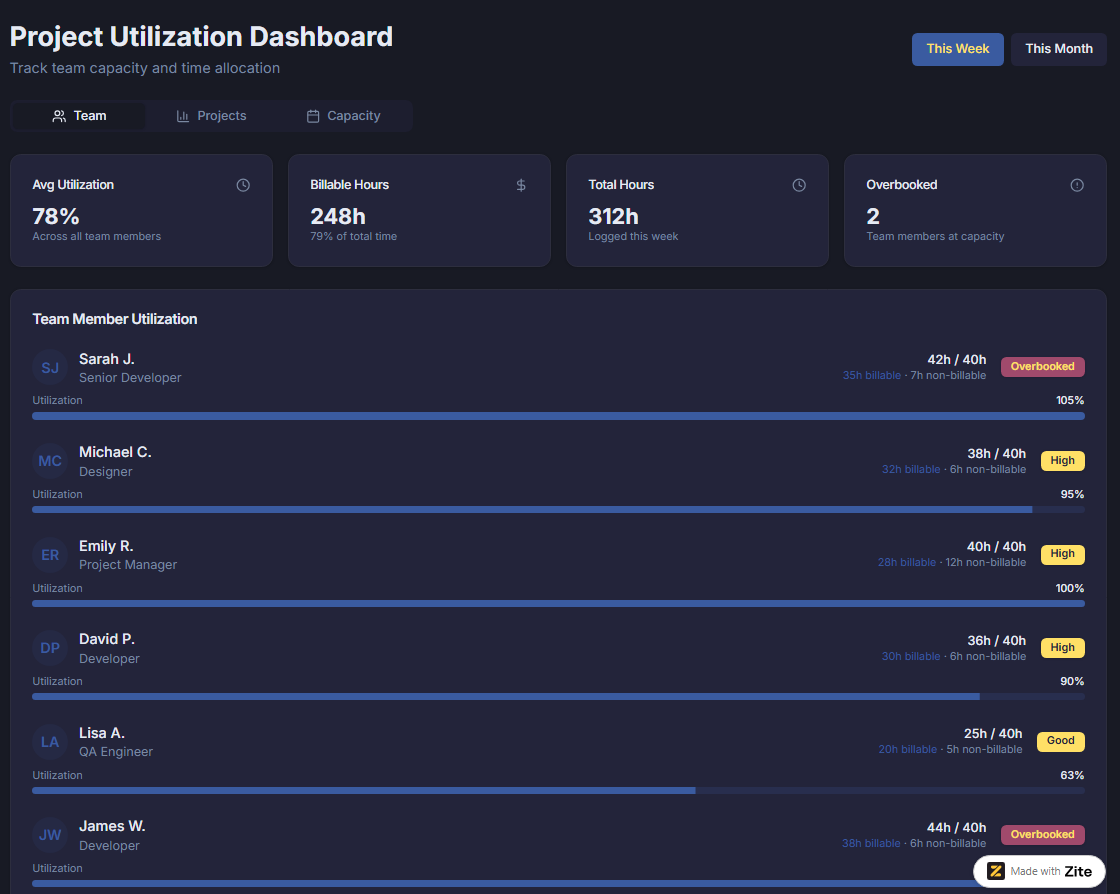
A project utilization dashboard focuses on how much of each person’s available time is in use. It often tracks things like billable vs non‑billable hours and what percent of someone’s time is booked. It's a bit different from a resource management dashboard, which shows the bigger picture of who is available, what they’re working on, and future capacity.
Key metrics to include:
- How much of each person’s time is used vs free
- Billable vs non‑billable hours
- Total hours worked per person and per project
- Capacity vs assigned hours (are people overbooked or underbooked?)
- Time spent on paid client work vs internal/admin work
Why it matters: It shows exactly who is overbooked, who has free time, and which projects are using more hours than planned. You can move work around before deadlines.
5 tools to build your project management dashboards
You can build project dashboards inside your project management tool, or use no‑code dashboard builders, or use a platform like Zite to create fully customized, stand-alone business apps.
Below are 5 tools worth considering and what they’re best for:
- Zite is an AI‑powered no-code platform for quickly generating dashboards and other business apps from prompts. It’s ideal when you need a custom project management dashboard but don’t want to write code or fight with rigid templates to make them fit your workflow.
- Notion lets you create databases for projects and tasks, then layer on boards, timelines, calendars, and rollups to act as simple dashboards. It’s ideal if you want an all‑in‑one workspace where docs, tasks, and light reporting live together.
- Smartsheet combines spreadsheet‑like sheets with configurable dashboard widgets (e.g., charts, metrics, reports, and images) that stay in sync with live project data. It works well when your org already lives in spreadsheets, and you need formal project status, timeline, and resource dashboards for stakeholders.
- Databox connects to tools like Jira, Teamwork, Harvest, and more, then lets you drag‑and‑drop prebuilt metrics into custom dashboards. It’s strongest when you want a reporting layer that pulls project, time‑tracking, and financial data into one view.
- ClickUp has customizable dashboards with widgets like workload, timelines, goals, and status reports, built on top of its own tasks, lists, and time tracking. Note that some of these dashboarding features are available only on paid plans. It’s a good fit if you already run projects in ClickUp.
Build your project management dashboard with Zite
Zite builds custom business tools so your dashboards match how your team actually works, instead of forcing you into a template.
That’s very different from the usual dashboard hunt.
If you search online, you’ll find dozens of pre‑made project dashboards in Excel, Notion, Airtable, and more, all with their own assumptions baked in. The resource dashboard might assume a team structure you don’t have, and if you stack enough of them, you end up with five dashboards across three tools.
Zite flips that script by starting from your real process and data. You start by describing the dashboards you need, then Zite generates apps and views that match that flow. Connect your actual data sources, adjust the UI, and manage multiple dashboards in one place. No need to ever write any code.
Here's how Zite helps:
- Production-ready, not prototypes: Zite builds apps that work reliably and scale. It comes with SSO support, user authentication, secure hosting, audit logs, and permissions. The platform is also SOC 2 Type II compliant.
- Easy to build and maintain: The AI generator makes it ridiculously easy to build apps. Just write what the dashboard should do, and Zite will build it. It will even connect it to your other tools, data sources, and add authentication for you.
- Visual workflows and editing: Your dashboard’s logic appears in a flow-chart interface. You can see how it works, inspect past runs, and reprompt to make changes. As for the UI, restyle and resize components directly using the visual edit tool. No need to touch code at all.
- Built-in database: Zite includes a powerful no-code database that scales with your needs. It has a spreadsheet-like interface so you can see and edit the data without writing code.
- Connect your existing tools: Pull data from Airtable, Google Sheets, and other systems you already use. Your dashboard stays current without manual updates.
Whether you're tracking a single project or managing a portfolio of initiatives, Zite gives you the flexibility to build exactly the dashboard your team needs without waiting on developers or settling for generic templates.
Ready to stop wrestling with spreadsheets? Start building your project management dashboard with Zite.
Frequently asked questions
What does a project management dashboard do?
A project management dashboard displays your project data, such as tasks, deadlines, budgets, and team workload in one visual overview. Most dashboards use charts, progress bars, and color-coded indicators to make it easy to spot what's on track and what needs attention.
How do I build a project management dashboard?
You can build a project management dashboard using a template, configure a project management tool, or create a custom solution using a tool like Zite.
What should I include in a project management dashboard?
Most dashboards include project status (on track, at risk, delayed), task progress, budget vs actual spending, upcoming deadlines, and team workload. Make sure to focus on what you actually need to make decisions and not cram in every possible metric.
Can I use Excel to create a dashboard?
Yes, you can use Excel to create a project management dashboard for single-project tracking, but most teams outgrow it quickly when managing multiple projects or collaborating across departments.