

Piecing together your team’s status from a task tracker, a spreadsheet, and a handful of Slack threads wastes time you don’t have. A team management dashboard pulls it into one view. Here are 7 examples I keep seeing, why they matter, and the best tools to build your own.
What is a team management dashboard?
A team management dashboard is a visual tool that pulls together key data about your team, such as workload, performance, attendance, goals, and time, into a single central view.
Usually, that information lives in different places: your task tracker, a spreadsheet, the HRIS, someone’s email, Slack messages, and a calendar. A team management dashboard puts all of that on one screen, so you can see your team's status without switching between tools.
Most team management dashboards have:
- Workload indicators: Who’s busy, who’s free, and who’s overloaded. Usually shown as a percentage of capacity.
- Performance tracking: Visual output, goal progress, and individual contributions as scorecards, charts, or progress rings.
- Key performance indicators (KPIs): The metrics that matter for your team. For sales, deals closed. For engineering, tickets shipped.
- Resource visibility: Who is assigned to which projects and tasks, and whether those assignments line up with each person's skills and bandwidth.
- Attendance and availability: Time-off schedules, working hours, and current availability across the team.
7 examples of team management dashboards
Here’s how teams put these elements together for different purposes.
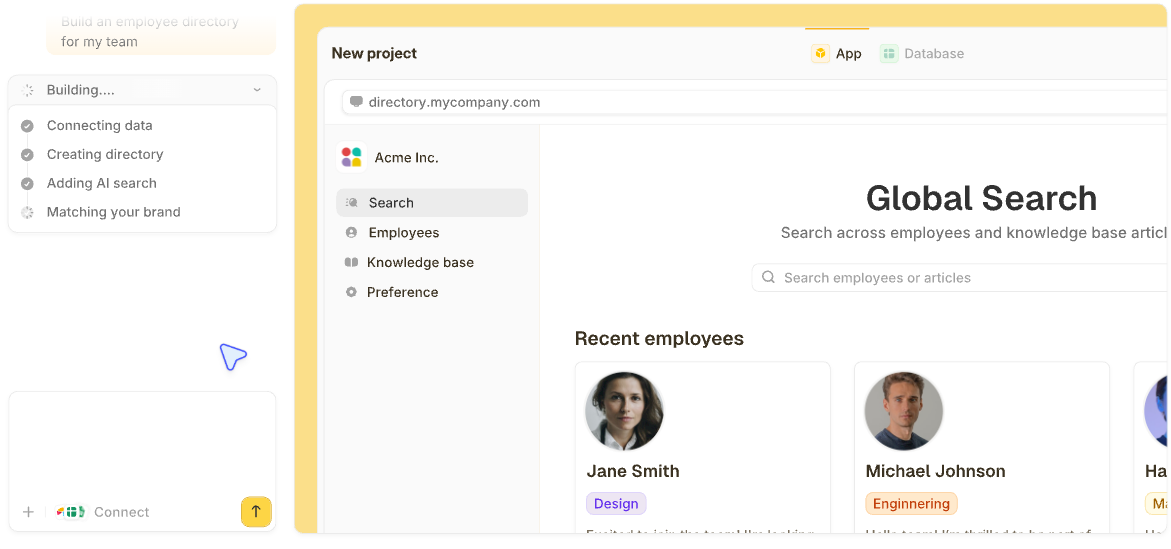
Note: I built all 7 examples below in Zite, an AI no-code app builder that generates custom dashboards from a prompt. It's the flexible option here because you're not locked into a fixed template, but you can start from ready-made dashboard templates in its marketplace.
The tools section below covers Zite and four other alternatives in more depth.
1. Team performance dashboard
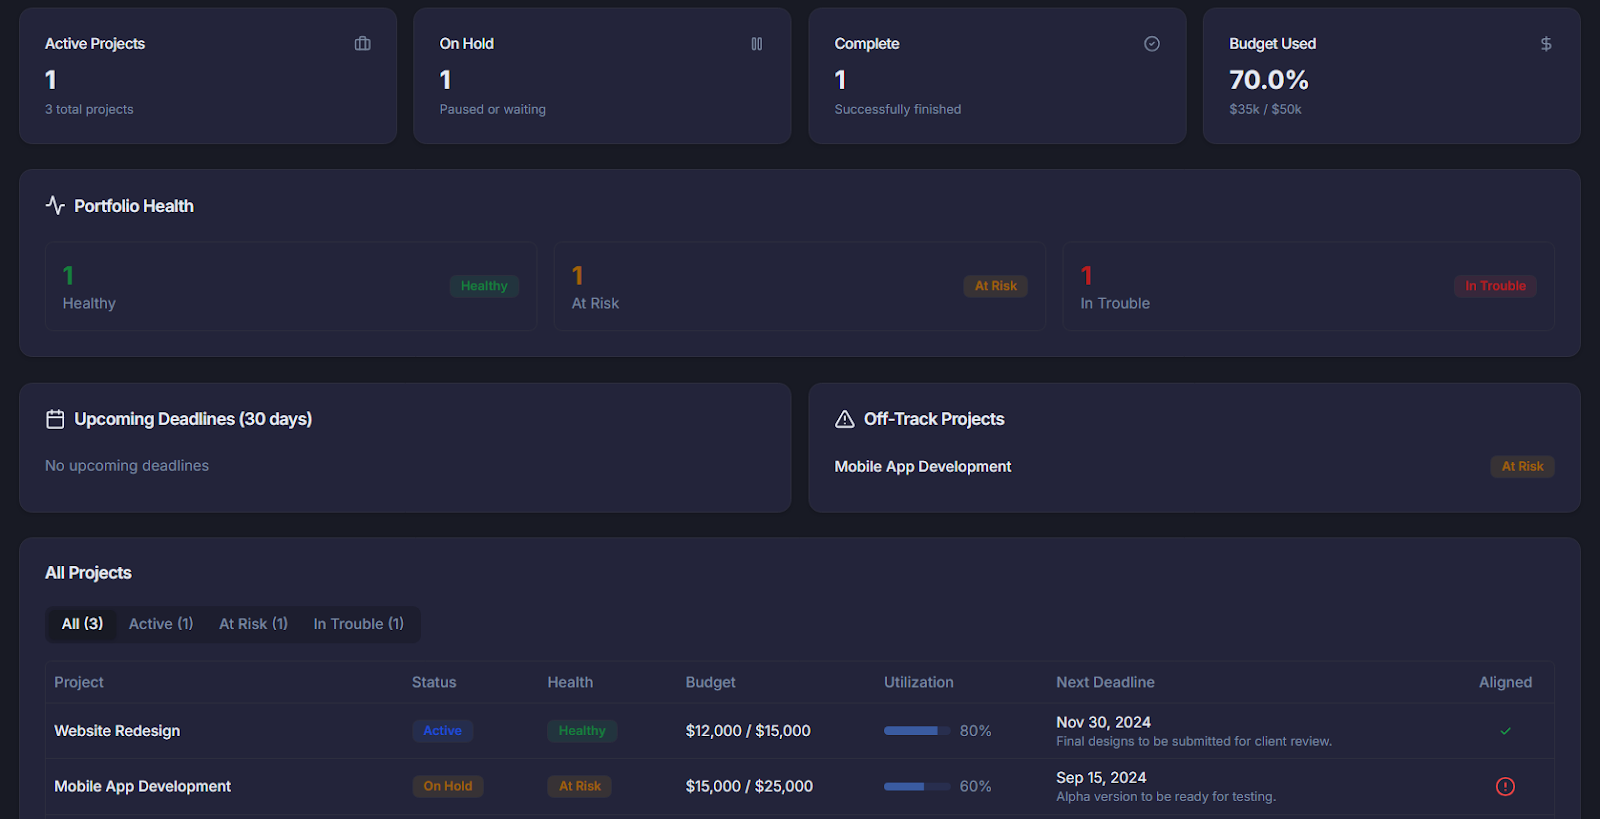
A team performance dashboard gives you a single view of how every person is delivering against their goals. Rather than checking in with each person individually, you see scorecards, completion rates, and KPI movement for the whole team on one screen.
Key metrics to include:
- Individual output (tasks closed, deals closed, tickets resolved).
- Goal progress per person (on track, at risk, behind).
- Average response or cycle time.
- Quality signals (rework rate, customer satisfaction scores).
- Trend lines showing whether output is rising or falling.
Why it matters: When you manage 8+ people, you can’t track each one in detail every week. A performance dashboard surfaces the patterns and outliers that need your attention.
2. Team workload and capacity dashboard
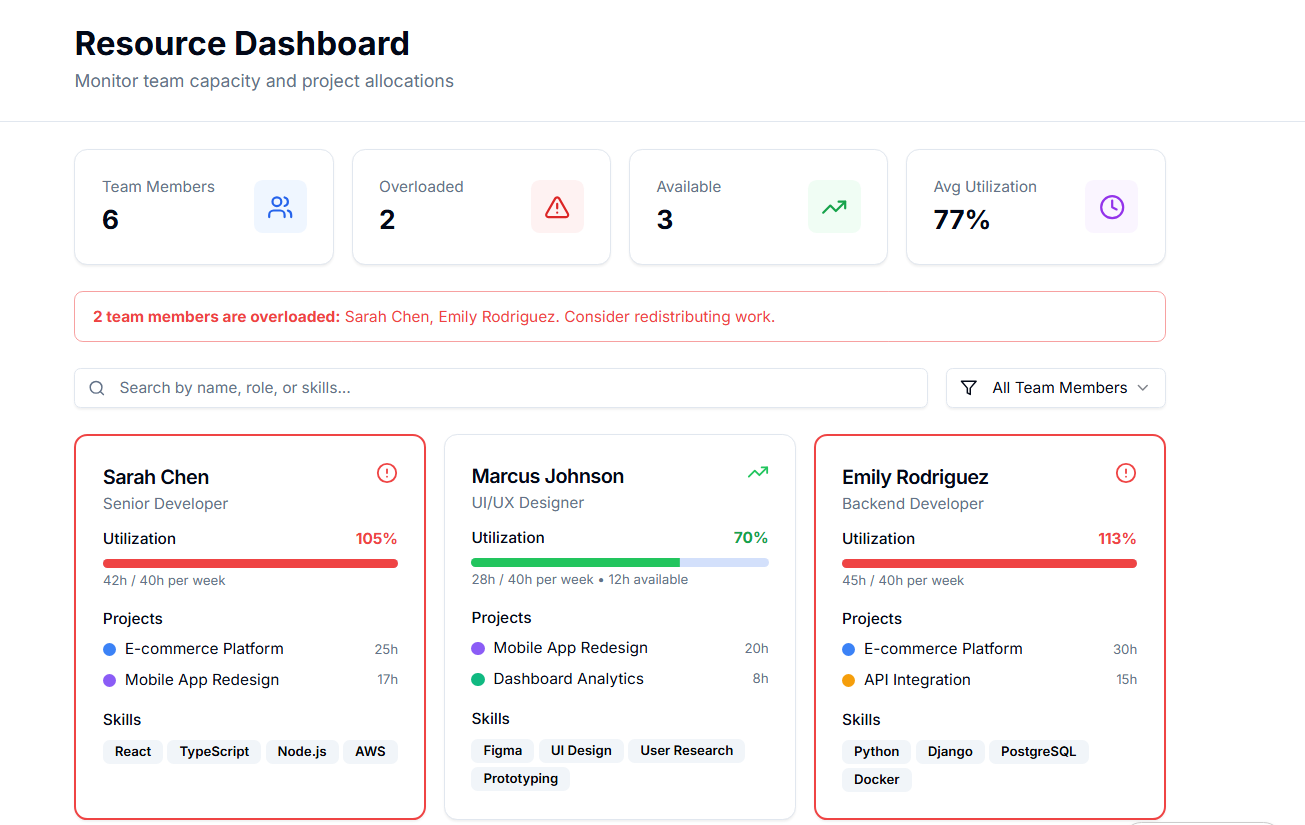
A workload dashboard shows who's doing what and how much room they have for more. Instead of finding out someone is overloaded after they miss a deadline, you spot the problem early and rebalance. Most teams start tracking capacity in a spreadsheet and outgrow it once the team passes a dozen people.
Key metrics to include:
- Capacity utilization per person (percentage or visual bar).
- Active projects or tasks per person.
- Upcoming work in the next 2 to 4 weeks.
- Alerts when someone is over-allocated.
- Skills or specializations each person brings.
Why it matters: When team members burn out, you get delays and lower-quality work. A workload dashboard helps you assign work that keeps people productive without pushing them past their limit.
3. Team productivity dashboard
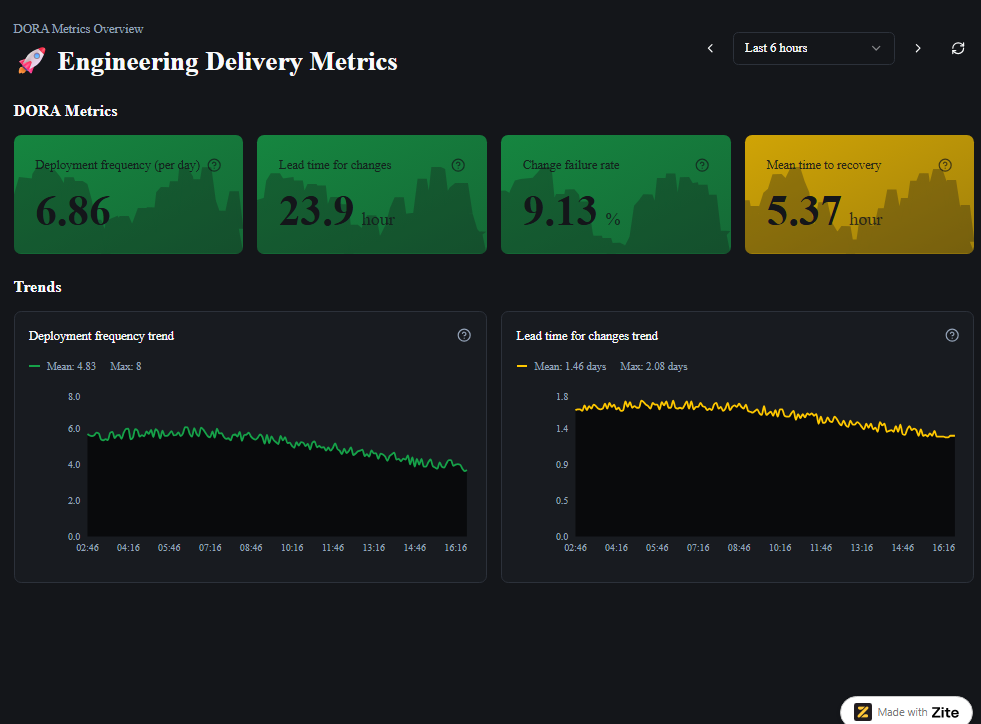
A productivity dashboard is a live view of how effectively your team is shipping work over time. It connects to the tools your team already uses and visualizes whether output is rising, holding steady, or slipping.
Key metrics to include:
- Throughput (tasks, tickets, or deals completed per week).
- Cycle time (how long it takes from start to finish).
- Work-in-progress count.
- Blocked items needing escalation.
- Percentage of planned work completed each cycle.
Why it matters: Productivity metrics show whether process changes are actually helping or whether new bottlenecks have emerged. You catch slowdowns early, rather than finding out at the quarterly review.
4. Time tracking and utilization dashboard
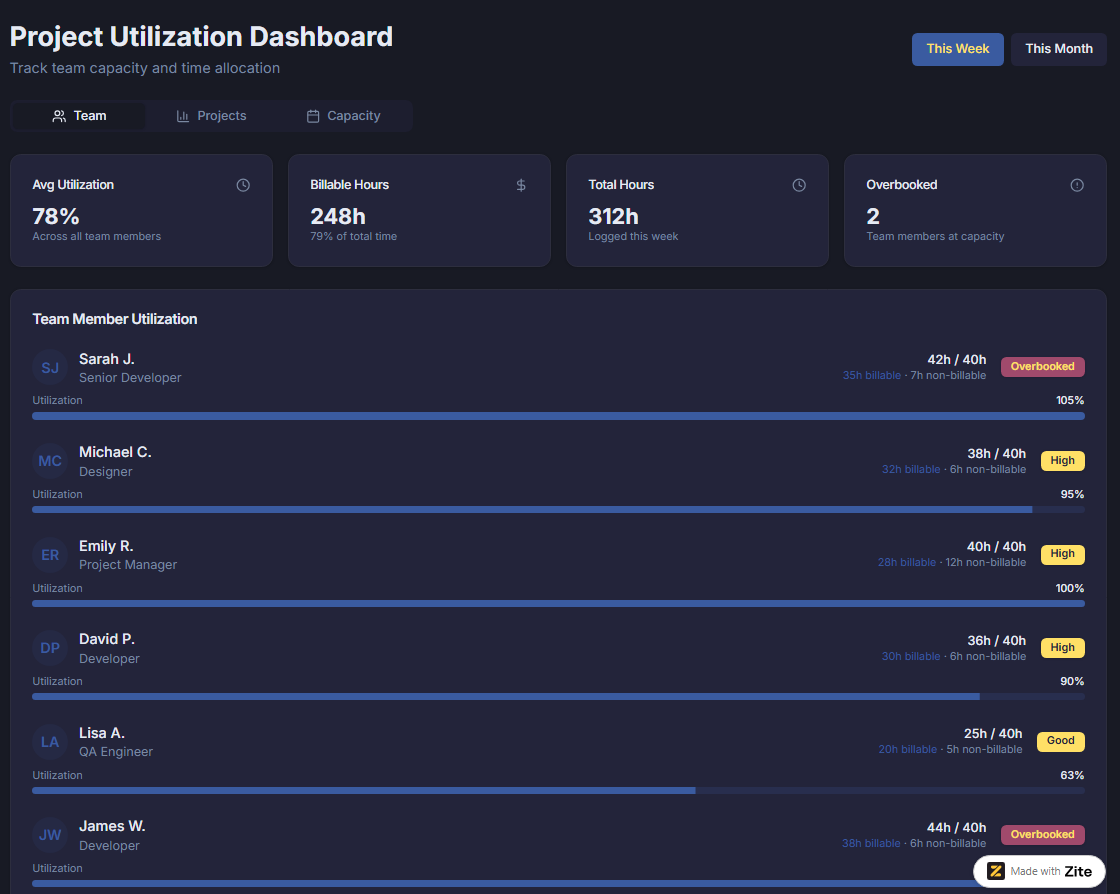
A time tracking dashboard focuses on how much of each person’s available time is in use, especially for service businesses where time directly translates to revenue. It tracks billable versus non-billable hours and what percentage of someone’s time is booked.
Key metrics to include:
- Billable vs non-billable hours per person.
- Total hours worked per project.
- Utilization rate (booked time / available time).
- Hours logged this week vs target.
- Time spent on paid client work vs internal admin.
Why it matters: For agencies and consulting firms, utilization is the financial heartbeat. A dashboard makes overbooked staff and under-billed projects visible before they show up in next month’s revenue report.
5. Team OKR and goals dashboard
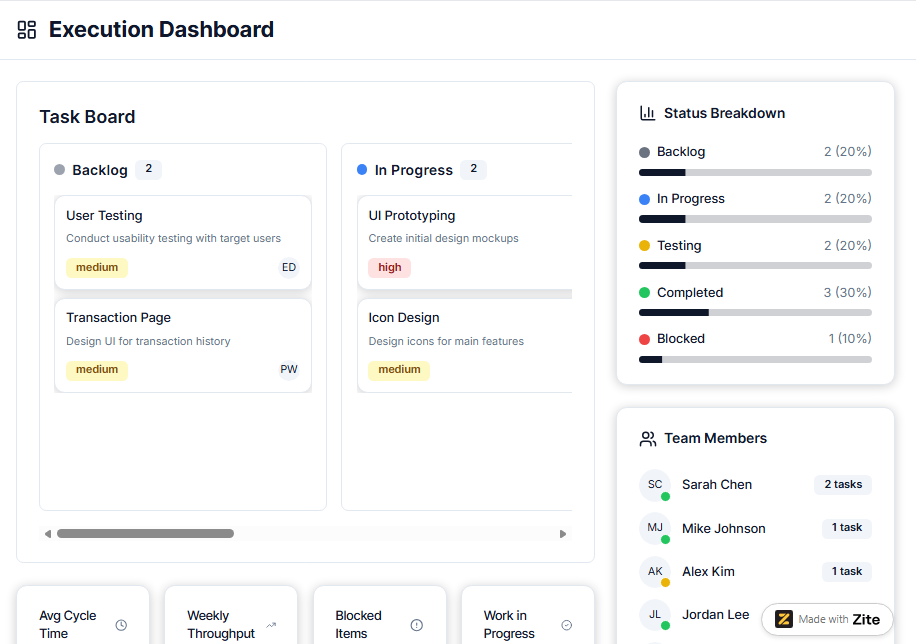
An OKR dashboard tracks what your team committed to this quarter and how close you are to each goal. It connects high-level objectives to the specific key results and the work happening underneath them.
Key metrics to include:
- Quarterly objectives and their owners.
- Key result progress (percentage to target).
- Confidence rating per OKR (on track, at risk, off track).
- Linked initiatives or projects driving each OKR.
- Trend lines showing movement over the quarter.
Why it matters: Most teams set OKRs in January and drift away from them by March. A live dashboard keeps goals visible and forces real progress conversations instead of end-of-quarter scrambles.
6. Hiring and recruiting pipeline dashboard
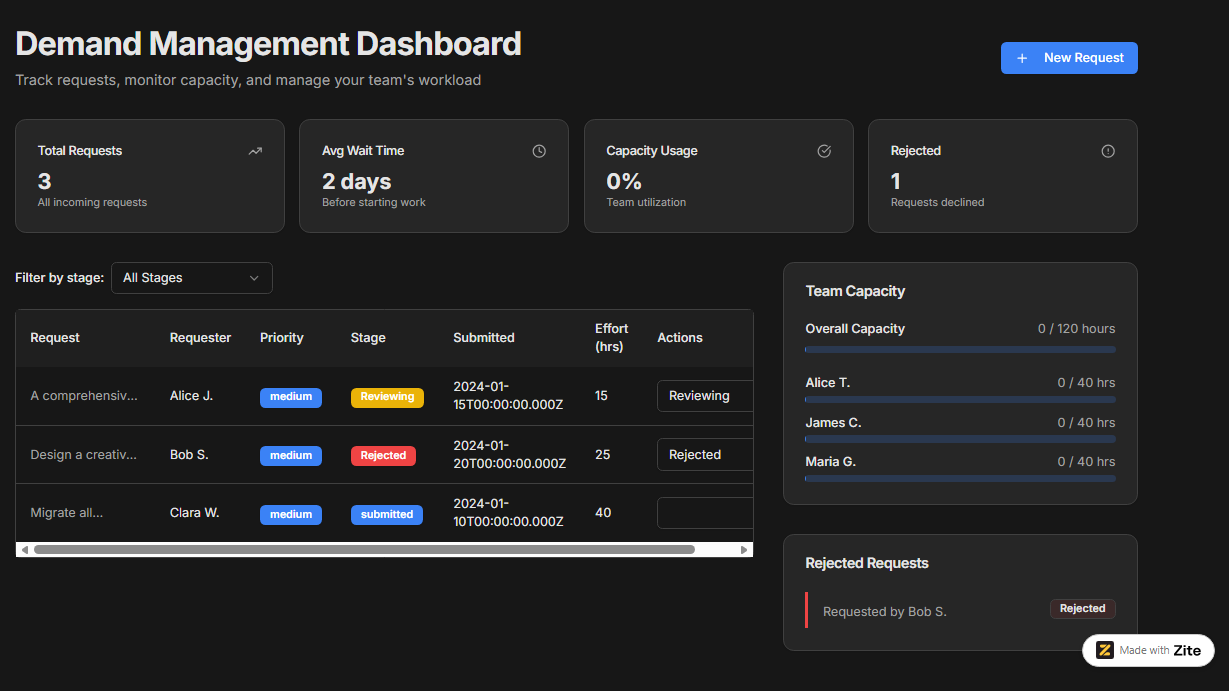
A hiring pipeline dashboard tracks every open role and every candidate moving through the interview process. It connects open headcount with active candidates so you can see whether the pipeline is healthy. The setup mirrors a custom CRM build, with stages, owners, and status tracking for each candidate.
Key metrics to include:
- Open roles by department.
- Candidates by stage (sourced, screened, interviewing, offered, hired).
- Time-to-hire per role.
- Source effectiveness (which channels produce hires).
- Conversion rate at each interview stage.
Why it matters: Hiring breakdowns are usually invisible until you have an empty seat for three months. A pipeline dashboard surfaces bottlenecks while you still have time to fix them.
7. Sales team dashboard
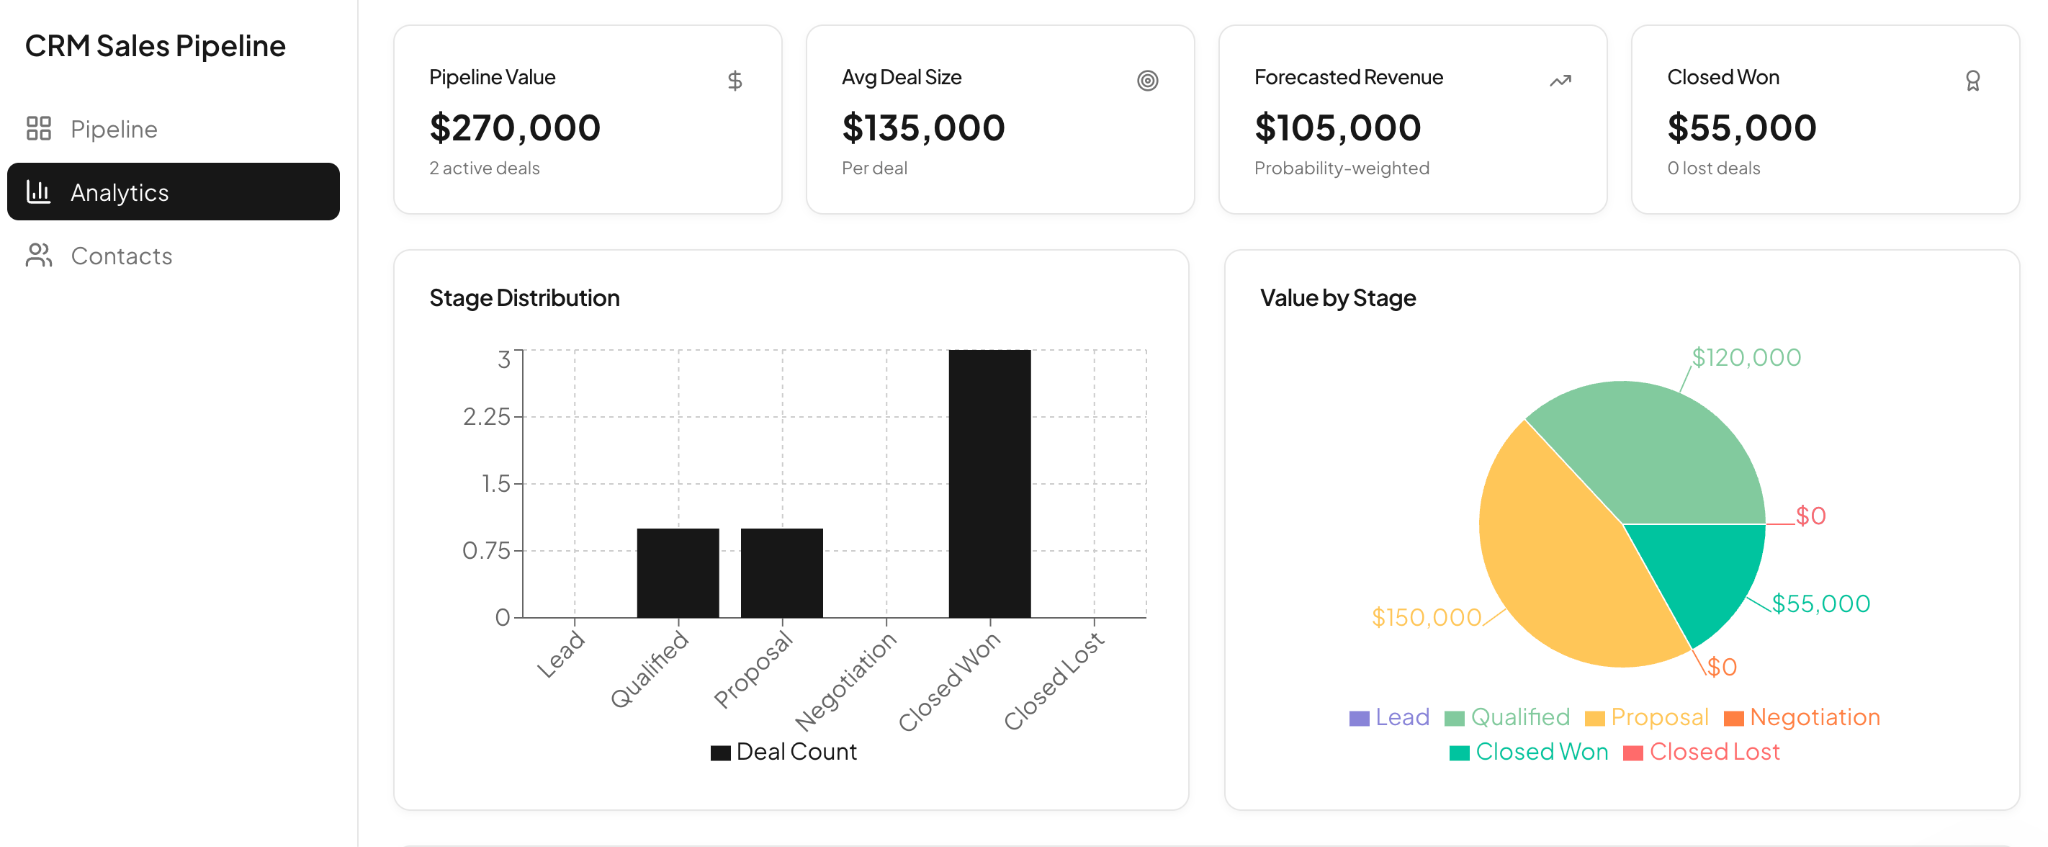
A sales team dashboard tracks how individual reps and the team are tracking against revenue targets. It combines pipeline value, deals at each stage, and per-rep activity into a single view that sales managers use daily.
Key metrics to include:
- Quota attainment per rep (percentage of target).
- Pipeline value by stage (lead, qualified, proposal, closed-won).
- Deals closed this period (count and average deal size).
- Activity metrics (calls made, demos booked, follow-ups sent).
- Win rate and average sales cycle length.
Why it matters: Sales managers can’t track every rep’s activity in real time, but a dashboard surfaces when a rep’s pipeline drops below safe levels weeks before the quota miss shows up in revenue numbers.
5 tools to build your team management dashboard
You can build team dashboards inside your existing task tracker or HRIS, use a dedicated dashboard tool, or use a no-code app builder like Zite to create a fully custom dashboard tied to your real data.
Below are 5 tools worth considering and what they’re best for:
- Zite is an AI-powered no-code app builder for quickly generating team management dashboards from prompts. Ideal when the other tools hand you pre-built widgets and layouts, but you want a dashboard generated around your own data and process.
- Monday.com combines team workflows with built-in dashboard widgets for workload, deadlines, and team activity. Works well if you already run your team’s work inside Monday.
- ClickUp has customizable team dashboards with widgets for workload, time tracking, goals, and status reports. Some advanced features are paid-only. A good fit if you already manage tasks in ClickUp.
- Notion lets you create databases for people, projects, and goals, then layer on boards, tables, and rollups. Ideal if you want docs, tasks, and light reporting in one workspace.
- Geckoboard connects to tools like Jira, HubSpot, and Google Analytics, then displays KPI widgets on a wall-mounted screen. Strongest when you want a visible scorecard your whole team can see.
Build your team management dashboard with Zite
Zite builds custom apps, so your team management dashboard matches how your team actually works, instead of starting from someone else's template.
Everyone on your team can use it without raising the bill. Monday, ClickUp, and Notion all charge per seat, so the dashboard gets more expensive with every person you add. Zite includes unlimited users on every plan, so a 5-person team and a 200-person org pay the same price, starting at $19/month.
That's very different from the usual dashboard hunt. Search online, and you'll find dozens of pre-made dashboards in Excel, Notion, and Airtable, each with its own assumptions baked in. Stack enough of them, and you end up with five dashboards across three different tools.
Zite works the other way: start from your real process and data, and it builds the dashboard around that. You describe the dashboards you need, then Zite generates the apps and views that match how your team operates.
Here’s how Zite helps:
- AI generation from a prompt: Describe what your dashboard should show, and Zite generates the database, app layout, and workflow logic together.
- Visible database with tables and fields: Real tables, linked records, AI Fields, and formulas you can inspect and edit visually.
- Visual workflows: Your dashboard's logic appears as a flowchart you can read and trace. If you set an alert to fire when someone's workload hits 100%, you can see exactly where that rule lives and what it does, then tell the AI what you want changed.
- Role-based permissions: Managers see their own team. Team members see their own metrics. HR sees the org-wide view. Roles work from day one.
- No per-seat fees: Zite includes unlimited users on every plan, so the bill doesn't grow as your team grows. Paid plans start at $19/month.
- Connect existing tools: Pull data from Airtable and Google Sheets and integrate other systems your team uses, such as your HRIS.
Whether you’re tracking a 5-person team or a 200-person org, Zite gives you the flexibility to build exactly the dashboard your team needs. Browse ready-to-use dashboard templates in the Zite marketplace, or start from a prompt.
Start building with Zite to get your team management dashboard live today.
Frequently asked questions
What does a team management dashboard do?
A team management dashboard displays your team’s data (workload, performance, attendance, goals, and time) in one visual overview. Most use charts, scorecards, and color-coded indicators to show who’s overloaded and which goals are slipping.
How do I build a team management dashboard?
You can build a team management dashboard in three ways: use a template in Notion or Monday.com, configure widgets in your existing task tracker, or create a custom dashboard with a no-code builder like Zite that generates it from a prompt.
What should I include in a team management dashboard?
Most team management dashboards include per-person workload, performance against goals, upcoming time off, and key KPIs. Focus on what you need to make decisions. A dashboard with 5 useful charts beats one with 30 ignored ones.
Can I use Excel to create a team management dashboard?
Yes, you can use Excel to create a team management dashboard for a small team, but most teams outgrow it quickly when managing multiple people or when data needs to be updated in real time. Beyond 10-15 members, a dedicated tool saves hours.
What’s the difference between a team management dashboard and a project management dashboard?
The difference between a team management dashboard and a project management dashboard comes down to focus. A team management dashboard focuses on the people (who are overloaded, on leave, and hitting goals). A project management dashboard focuses on the projects (status, milestones, budget, and timeline). Most teams need both.