
A sales tracker in Google Sheets starts with seven core columns: Date, Client Name, Product/Service, Sales Rep, Stage, Amount, and Source.
The Stage column runs on four values: Lead, In Progress, Won, and Lost. I've built this exact structure for small sales teams more times than I can count. The version that survives past week one always starts with these seven columns and a Stage dropdown.
Here's the full build. It covers the columns, formulas, and a second variant if a full pipeline is more than you need yet.
Get the free sales tracker Google Sheets template
Copy the free sales tracker template to skip straight to a working tracker, with the columns, Stage dropdown, and every formula in this guide already built in. Opening the link saves a copy to your own Google account, so nothing you change affects the original.
The steps below walk through the same tracker from scratch, for building it by hand or understanding what each formula does.
What you'll need before starting
Prerequisites:
- A Google account with access to Google Sheets
- A rough list of what you're tracking: deals, one-time sales, or both
- No paid add-on required
Time required: 15 to 20 minutes for the core tracker, another 10 for the dashboard tab.
How to build a sales tracker in Google Sheets: step-by-step
Step 1: Set up your columns
In row 1, enter these headers across columns A through G:
| A | B | C | D | E | F | G |
|---|---|---|---|---|---|---|
| Date | Client Name | Product/Service | Sales Rep | Stage | Amount | Source |
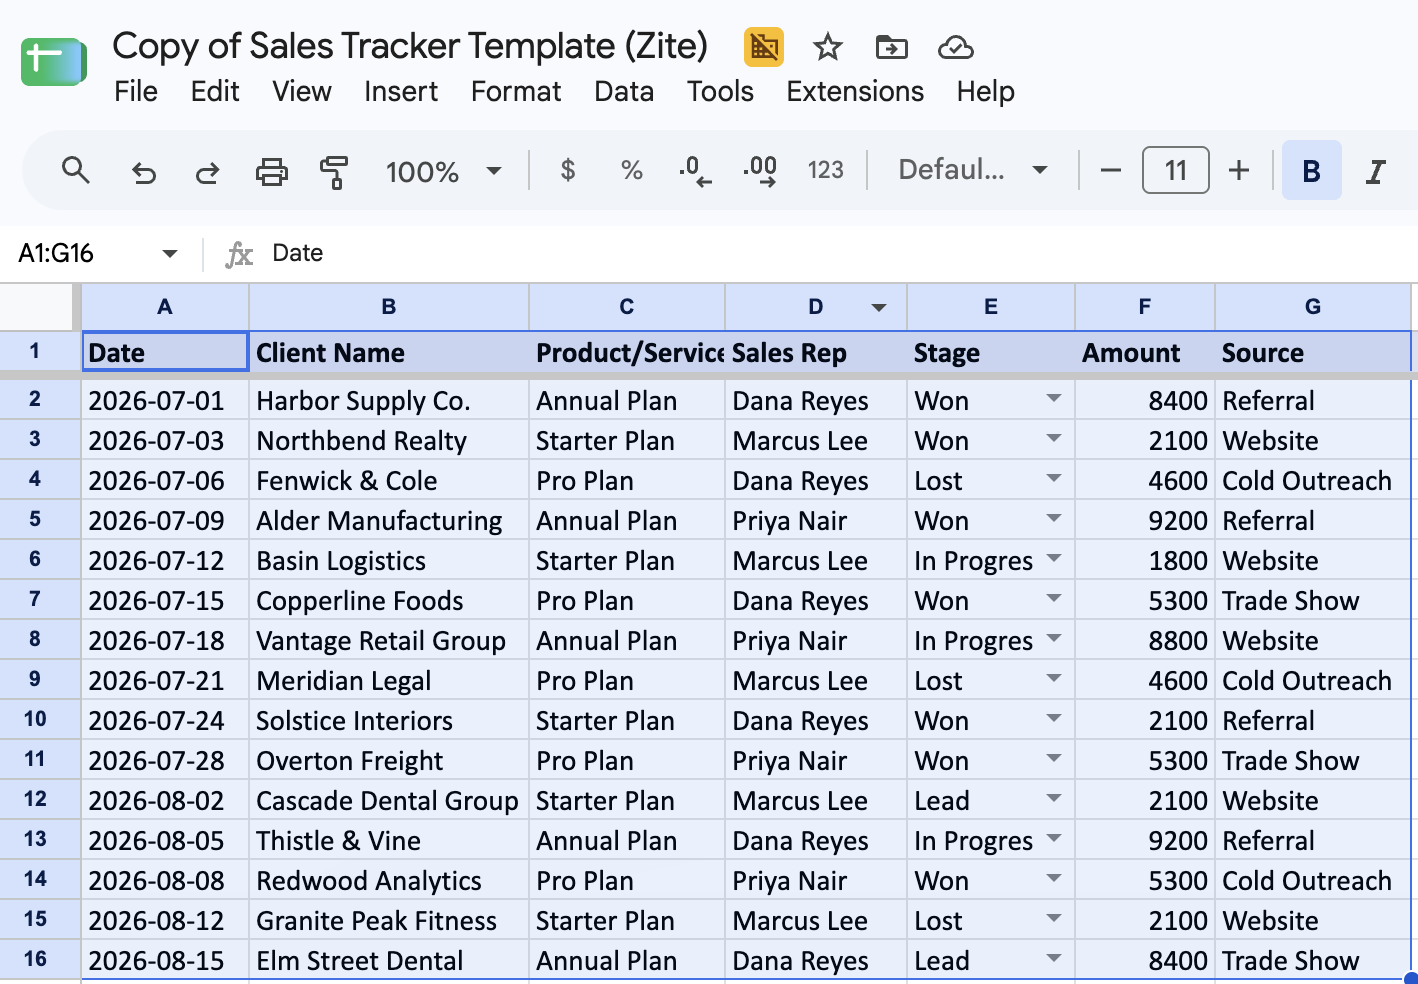
This order matters for the formulas later, since they reference these exact columns. If you rearrange them, the formulas need to be rewritten to match.
Then double-click the Sheet1 tab at the bottom of the screen and rename it Tracker. Every dashboard formula later in this guide expects that exact tab name.
Step 2: Freeze and bold the header row
Select row 1, then go to View > Freeze > 1 row. The headers stay visible now, no matter how far down the sheet you scroll. Bold the row with Ctrl+B (Cmd+B on Mac) to set it apart from the data below.
Pro tip: Do this before entering any data. It's a five-second step that's easy to forget once the sheet already has rows in it.
Step 3: Set up the Stage dropdown
Select the Stage column (E2:E1000 covers plenty of room to grow), then go to Data > Data validation, click Add rule, and choose "Dropdown" as the criteria. Enter these four options: Lead, In Progress, Won, Lost.
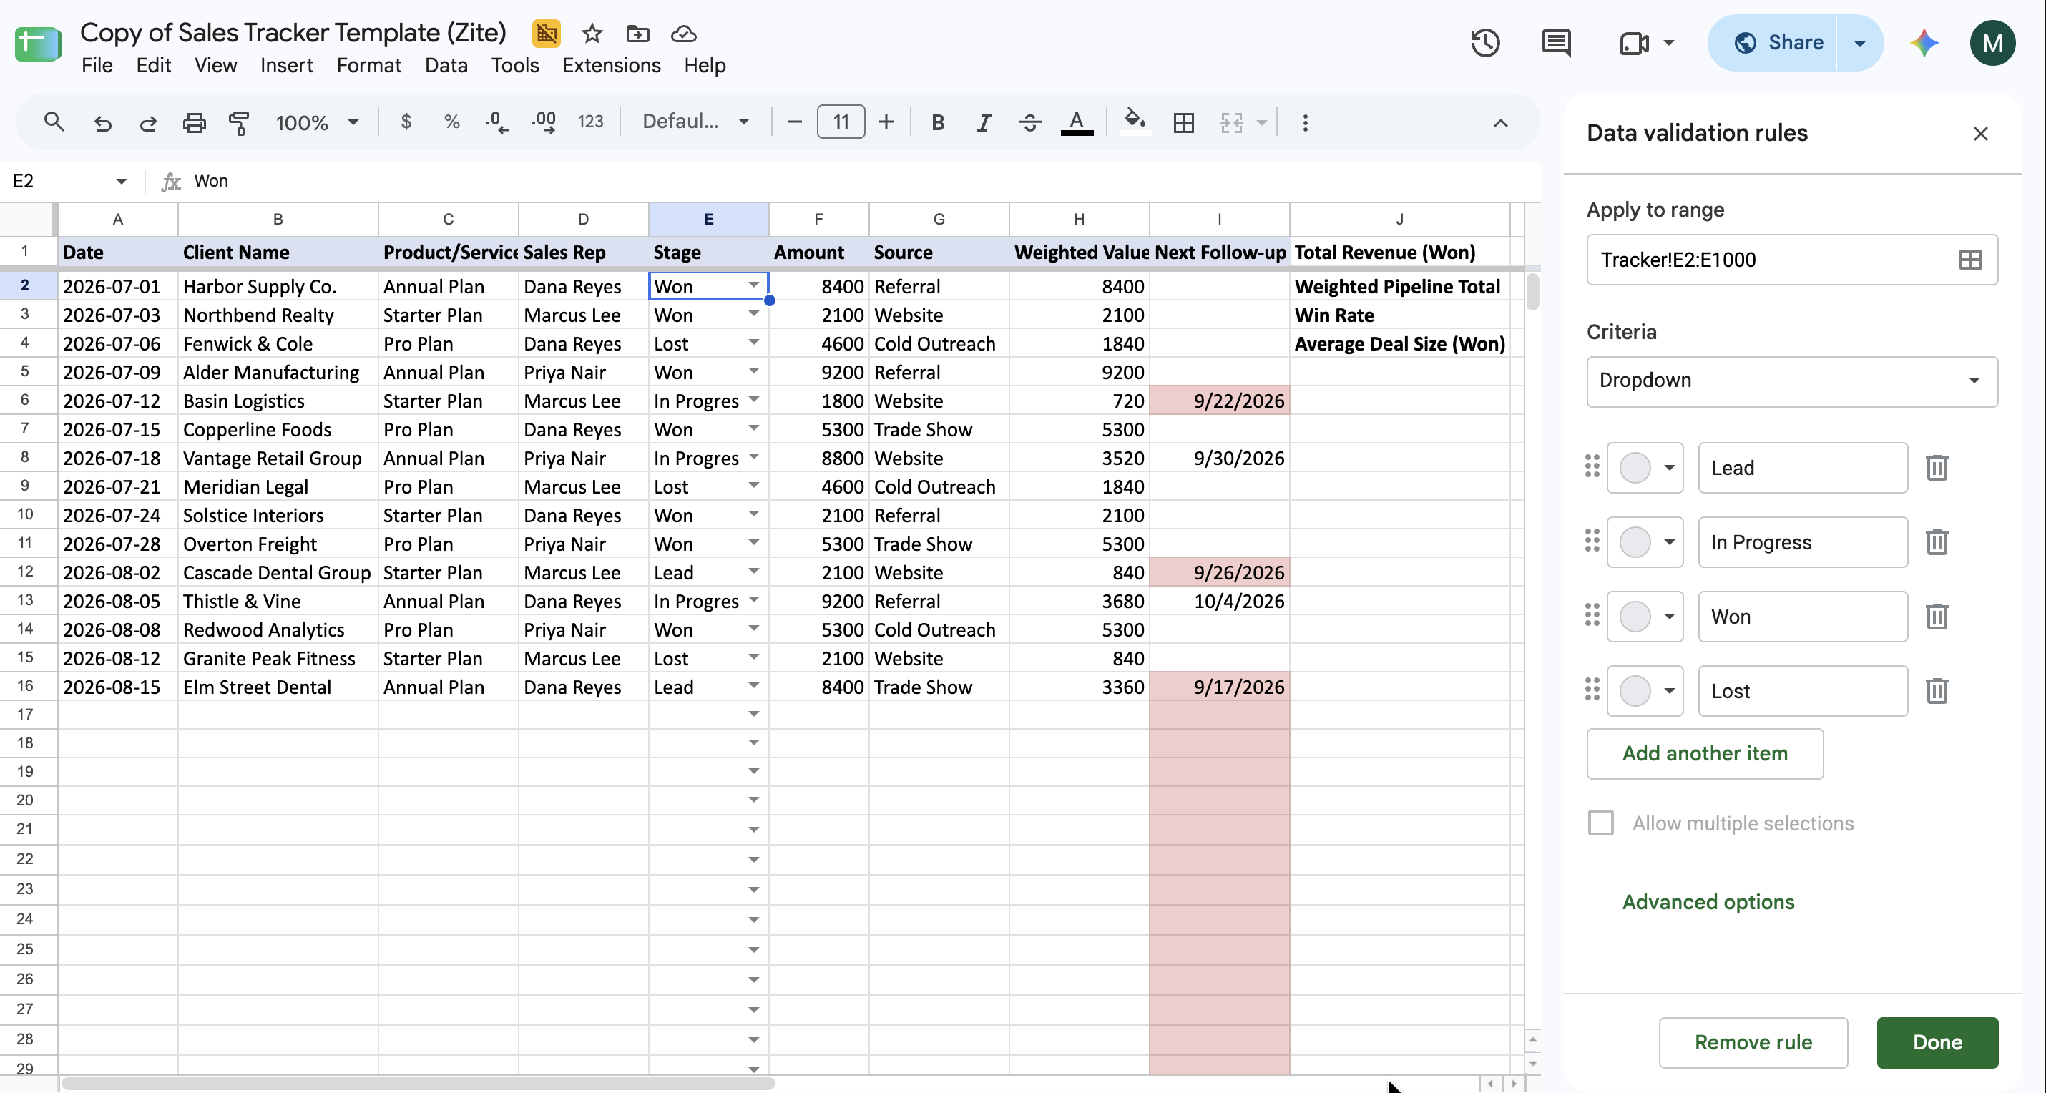
This one dropdown is what makes every formula after this step possible. Skip it, and a typo like "Wonn" or a stray trailing space after "Won" slips past every formula below, shrinking your totals without you noticing.
Step 4: Add the revenue formula
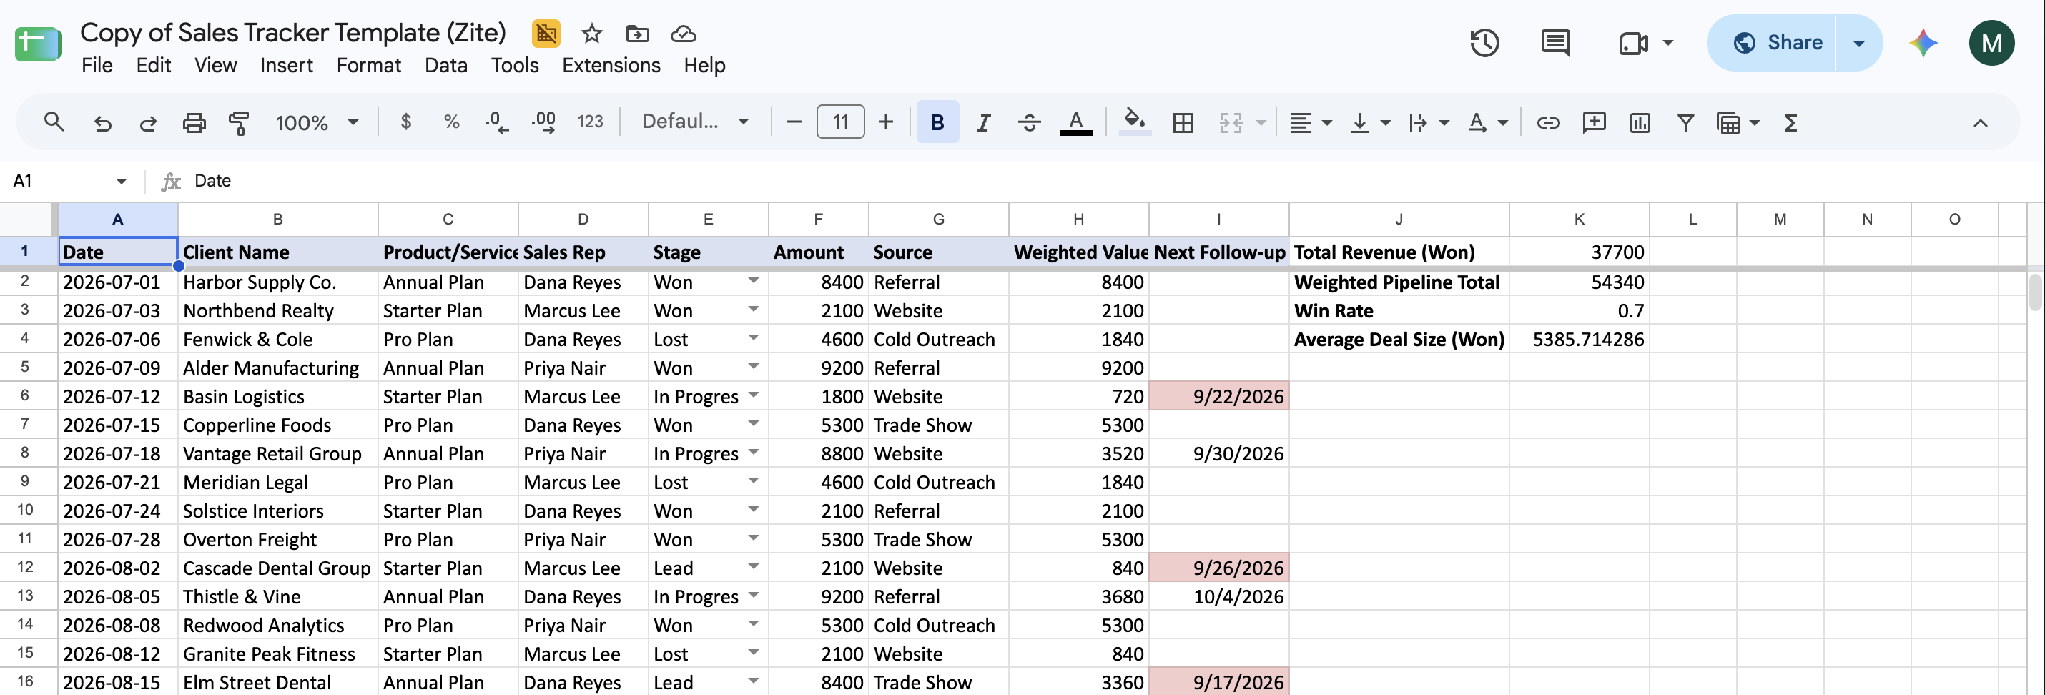
In an empty cell, like K1, calculate total closed revenue:
=SUMIF(E2:E1000,"Won",F2:F1000)
This sums the Amount column, counting only rows where Stage is "Won," so the total reflects closed revenue alone.
Step 5: Add a weighted forecast column
In column H, add a header like "Weighted Value," then in H2:
=IF(E2="Won", F2, IF(E2="Lost", 0, F2*0.4))
This counts a won deal at full value, a lost deal at zero, and every open deal at 40% of its value, a simple weighting that assumes roughly two in five open deals eventually close. Copy this formula down the column as you add rows.
Then total the weighted pipeline in another cell:
=SUM(H2:H1000)
Pro tip: Treat 40% as a starting point. Once you have a few months of data, adjust the 0.4 up or down to match your own close rate.
Step 6: Add win rate and average deal size
Win rate, in its own cell:
=IFERROR(COUNTIF(E2:E1000,"Won")/(COUNTIF(E2:E1000,"Won")+COUNTIF(E2:E1000,"Lost")), 0)
This divides won deals by won-plus-lost deals, so an open deal counts neither for nor against the rate until it closes. Format that cell as a percent (Format > Number > Percent), or it displays as a decimal like 0.4 instead of 40%.
Average deal size:
=IFERROR(AVERAGEIF(E2:E1000,"Won",F2:F1000), 0)
Step 7: Add a follow-up column and flag overdue deals
In column I, add a header called "Next Follow-up," then enter a date for each open deal, the next time you plan to check in.
Select I2:I1000, go to Format > Conditional formatting, and set the rule to Custom formula is:
=AND($I2<>"", $I2<TODAY(), $E2<>"Won", $E2<>"Lost")
Set the fill color to red. Any open deal with a follow-up date in the past turns red the moment you open the sheet, catching a stalled deal before it goes unnoticed.
Step 8: Give each rep a filtered view
Go to Data > Create filter view, then filter the Sales Rep column to one name. Each rep can build their own filter view this way. Each rep's filtered view shows only their own deals, while the underlying shared sheet stays unfiltered for everyone else.
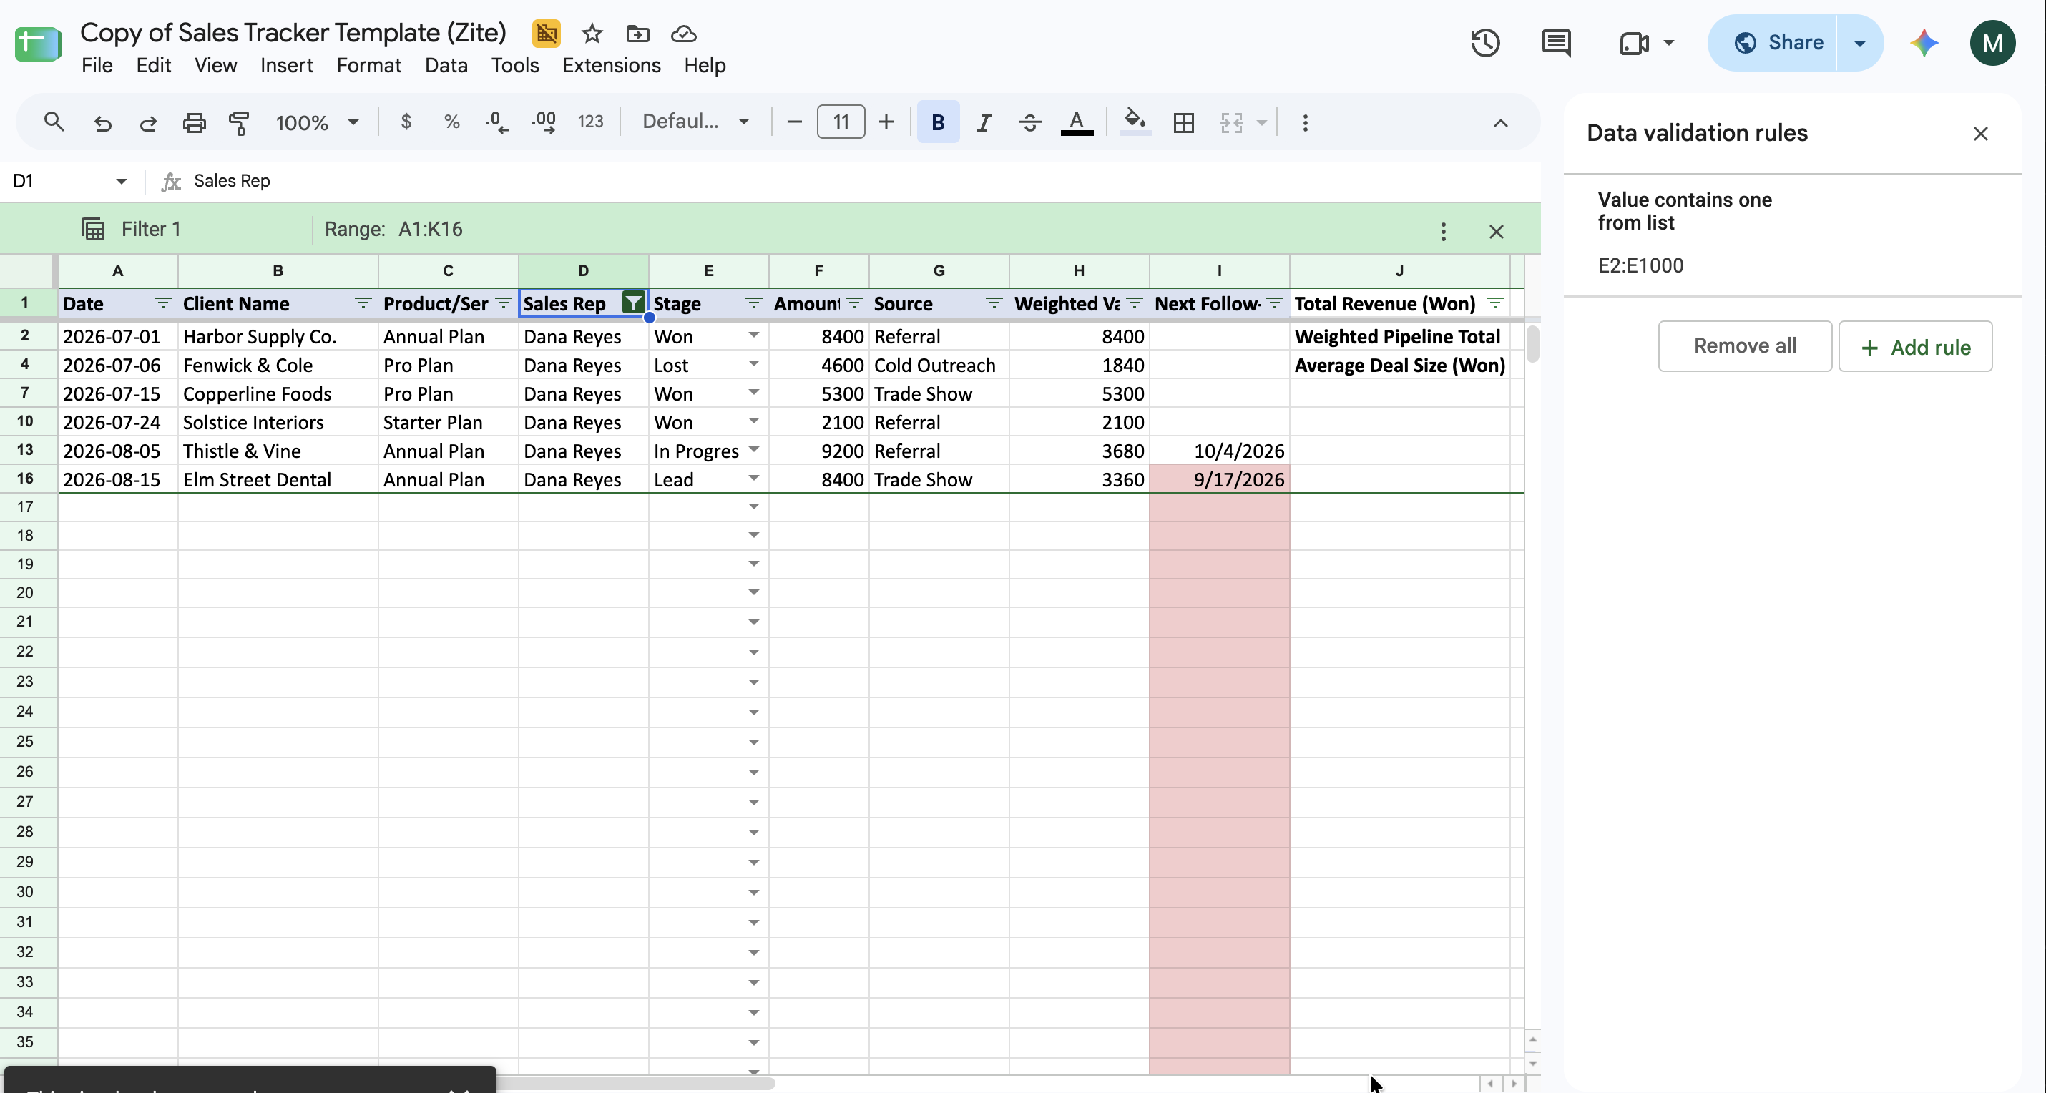
Pro tip: A filter view won't stop anyone from seeing other reps' deals. Anyone with edit access can still open Data > Change view, switch to a different one, or clear it to see everyone's deals again.
Build a dashboard tab with charts
Add a second tab called Dashboard. Build a small summary block first, since charting raw transaction rows directly doesn't visualize well.
Here's the summary block to build:
| Stage | Count | Total Value |
|---|---|---|
| Lead | =COUNTIF(Tracker!E:E,"Lead") | =SUMIF(Tracker!E:E,"Lead",Tracker!F:F) |
| In Progress | =COUNTIF(Tracker!E:E,"In Progress") | =SUMIF(Tracker!E:E,"In Progress",Tracker!F:F) |
| Won | =COUNTIF(Tracker!E:E,"Won") | =SUMIF(Tracker!E:E,"Won",Tracker!F:F) |
| Lost | =COUNTIF(Tracker!E:E,"Lost") | =SUMIF(Tracker!E:E,"Lost",Tracker!F:F) |
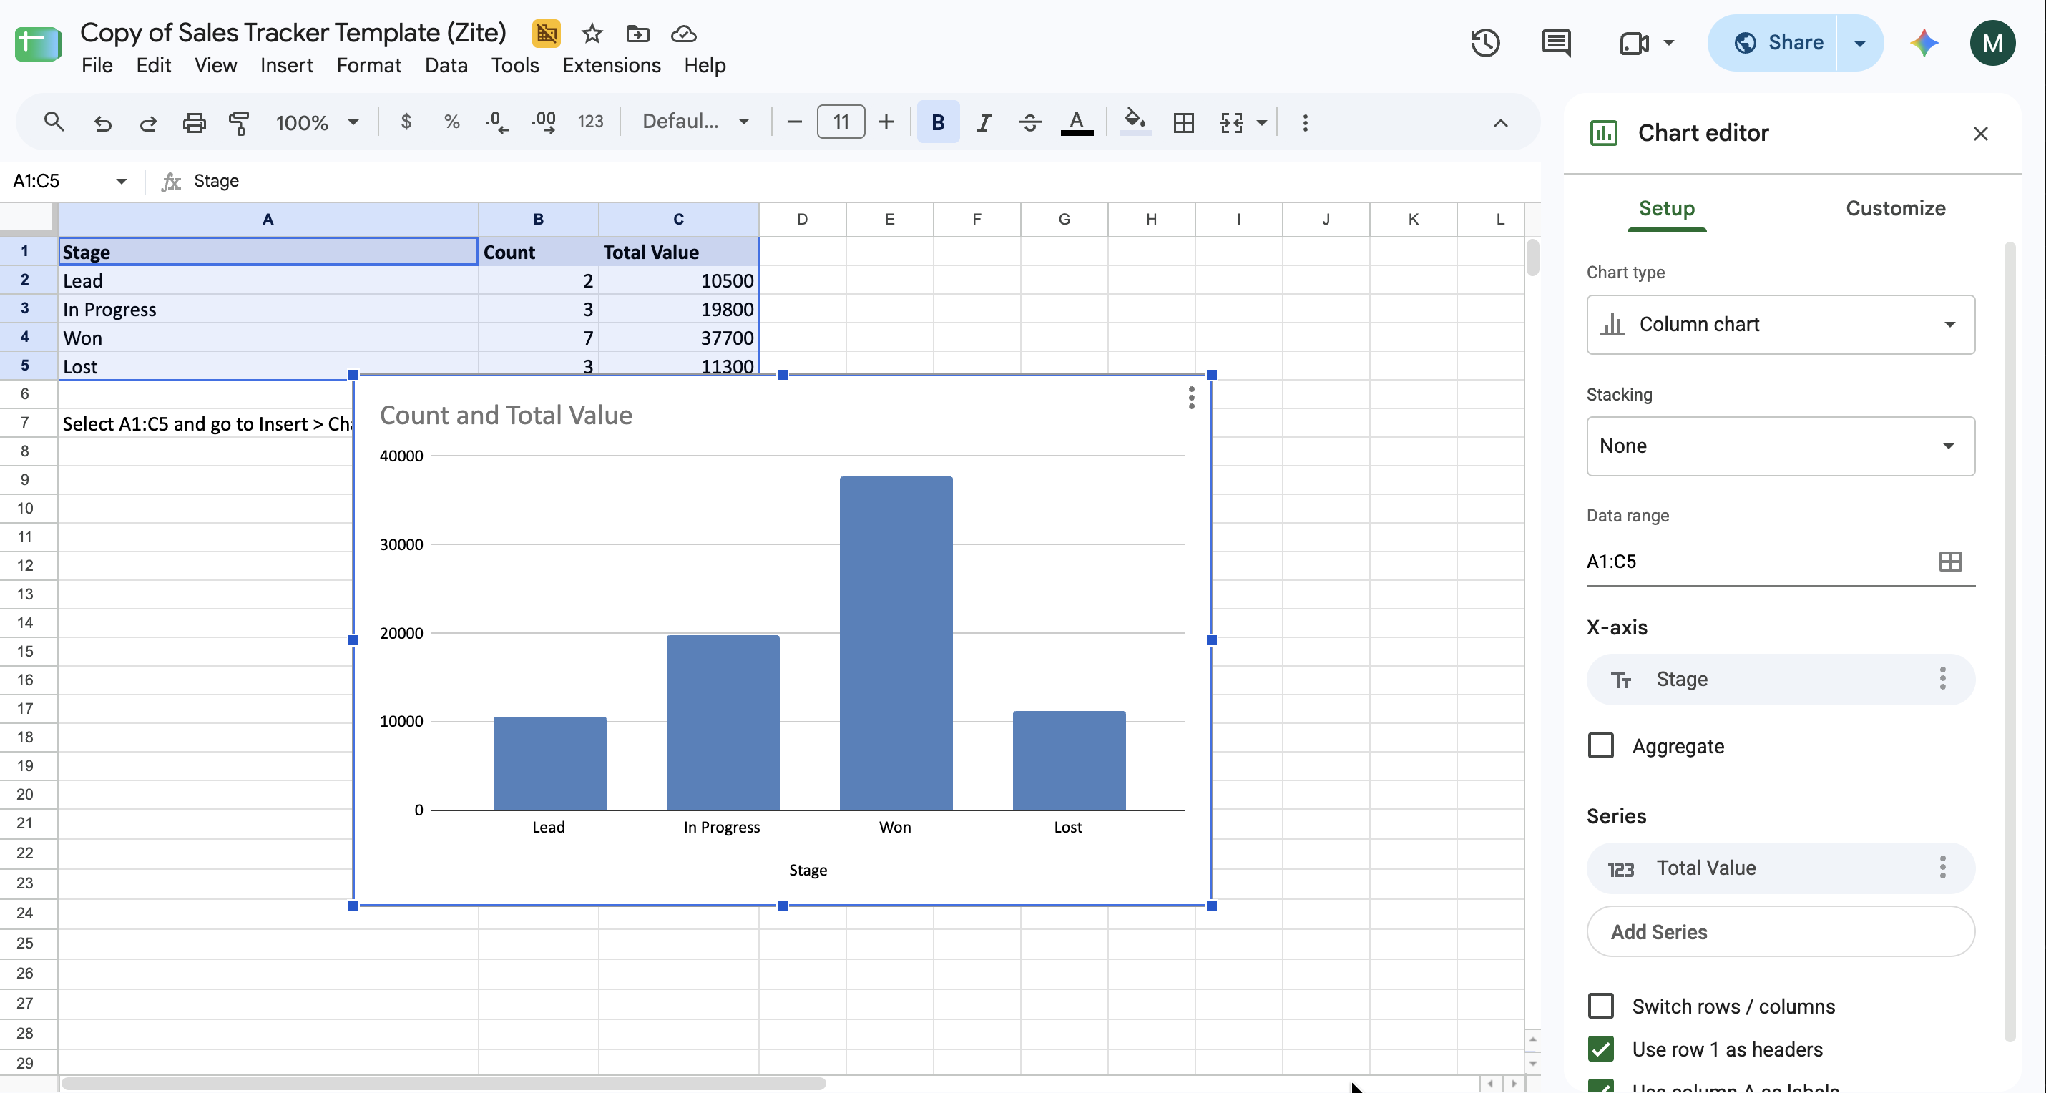
Select that summary block and go to Insert > Chart for a pipeline-by-stage bar chart.
For the revenue trend, build a monthly summary first. Select Insert > Pivot table and set the data range to Tracker!A1:I1000, so new deals land inside it. Set Date as rows, then right-click a date cell in the pivot and choose Create pivot date group to group it by month. Set Amount as the summed value.
Repeat the chart steps above against that monthly pivot table instead of the Stage summary, for a revenue trend line.
The pivot table and chart pick up new deals on their own, as long as they fall inside that range. This breakdown of an operations dashboard template walks through a version that goes further.
For the AI-generated route instead, this guide to building a dashboard with AI covers it end to end.
Capture new leads with a Google Form
New leads still have to get into the tracker somehow. Build a short Google Form with one question per detail you need to capture, covering at least Client Name, Product/Service, and Source.
Then point the form's response destination at this same spreadsheet. Submissions land in a new tab of their own, with the submission time filled in automatically. Copy each new lead over by hand and set its Stage to Lead.
Pro tip: Order the form's questions to match your tracker's columns before the first response comes in. Forms lays out its response tab in question order, and reordering afterward means moving columns by hand.
Two tracker variants
Here are the two versions, so you can pick the one that matches your process:
Simple sales log: Drop the Stage column and its formulas if you're tracking completed sales instead of a pipeline. Keep Date, Client Name, Product/Service, Sales Rep, Amount, and Source. With Stage gone, Amount shifts into column E, so total revenue is a plain =SUM(E2:E1000).
Full pipeline tracker: Use all nine columns, the seven base plus Weighted Value and Next Follow-up from Steps 5 and 7, and every formula above. This fits a team working deals through stages, where forecasting and win rate matter alongside the sales total.
If your sales process is headed toward a full pipeline anyway, this walkthrough of building a CRM system from scratch lays out the next step.
Common mistakes to avoid
Here are the five mistakes to watch for:
- Typing stage values instead of using the dropdown: Free-typed entries break every COUNTIF and SUMIF formula that depends on an exact match.
- Formulas referencing the wrong columns after reordering: Moving a column without updating the formulas silently points them at the wrong data.
- No frozen header row: Scrolling through a growing tracker without frozen headers means constantly losing track of which column is which.
- Fixed ranges that stop covering new rows: A formula range like E2:E50 stops counting new rows once you pass row 50, with no warning. Build in extra room, like E2:E1000, from the start.
- Leaving the header row and formula columns unprotected: Anyone with edit access can overwrite a header or formula cell by accident. Protect row 1 and your formula cells under Data > Protect sheets and ranges, but leave Stage open so reps can keep updating deals.
Where a spreadsheet sales tracker hits its limits
This tracker handles a working sales process well up to a point: a few hundred deals, one to a few reps, and manual updates that someone remembers to make. Past that, it runs into problems a spreadsheet formula can't fix.
The conditional-formatting flag from Step 7 and the filter views from Step 8 help, but they don't change how the sheet works underneath. Sharing in Google Sheets is set per file, so anyone who can open it can see every rep's deals. Protected ranges stop people from editing a cell, not from reading it, and a filter view can be cleared in one click.
Copies drift too: once reps download the sheet or duplicate a tab to work in their own version, the numbers stop matching. And the red follow-up flag only shows up when someone opens the sheet.
For more on what changes at that point, this guide to building your own CRM system without code walks through turning this same tracker into a full app, stage by stage.
If a ready-made tool makes more sense than building one, this roundup of the best CRM software for small businesses weighs the options.
Turning your tracker into an app
Zite picks up where the spreadsheet runs out of room. Describe the same tracker, stages, reps, and how you want open deals weighted, and Zite builds both the app and the database behind it, with every table and workflow open for you to inspect.
Here's what changes once the tracker becomes an app:
- Follow-ups that happen on their own: On the Business plan and up, a scheduled check finds deals that have gone cold and emails the rep a reminder, or sends the client a follow-up from your own Gmail or Outlook.
- AI on every deal: AI fields can summarize call notes, tag a deal's industry, or draft a follow-up, and they can be set to fill in automatically as new deals arrive.
- Per-rep access: Each rep signs in and sees only their own deals, and a manager can see the whole team's pipeline. Unlike a filter view, it can't be cleared to show more than the rep should see.
- Formulas in plain English: Describe the calculation, such as "weighted value is 40% of the amount for open deals" or "10% commission on won deals," and Zite writes the formula. Each result updates when its inputs change, with no ranges for new deals to fall outside of.
- Builds from your sheet: Import this same spreadsheet and your existing deals become tables in Zite's database, and you describe the app you want around them, instead of starting from a blank slate.
- Unlimited users: Every plan includes unlimited users, so adding another rep never adds a fee.
Zite is free with unlimited users and 50 AI credits a month, capped at ten messages a day. Paid plans start at $25/month for Pro, with 100 credits and a custom domain. Business is $89/month with 400 credits. Team is $300/month with 800 credits, and Enterprise is custom-priced.
Start building with Zite for free once your sales tracker in Google Sheets has outgrown what formulas can hold.
Frequently asked questions
What is a good spreadsheet for tracking sales?
Google Sheets is a good spreadsheet for tracking sales, since it's free, shareable, and flexible enough to hold a full pipeline tracker with stages and weighted forecasting. It works well up to a few hundred deals or a handful of reps, and starts to strain past that point.
Is there a free sales tracker template?
Yes, the free template above is a ready-made sales tracker with the columns, Stage dropdown, and every formula in this guide already built in. Copy it to your own Google account, and it's ready to use right away.
How do I create a sales tracker in Google Sheets?
Create a sales tracker in Google Sheets by setting up seven columns (Date, Client Name, Product/Service, Sales Rep, Stage, Amount, Source), adding a Stage dropdown through Data > Data validation, and building formulas for revenue, weighted forecast, win rate, and deal size on top of that structure.
How do I create a sales dashboard in Google Sheets?
Create a sales dashboard in Google Sheets by adding a second tab with a summary block that counts and sums your tracker by stage, then building a chart from that summary instead of the raw tracker rows, since a chart against individual transactions is hard to read.
Can Zite help me track sales?
Yes, Zite can help you track sales. Describe your stages, your reps, and what should happen when a deal goes cold, and Zite builds the tracker app with its own database, a login for each rep, scheduled follow-ups (Business plan and up), and AI fields that summarize deals. Start from scratch or import your current sheet.