
Google Sheets project management works well as one task table with a status dropdown and color-coded rows, and the basic version takes about 15 minutes to set up. It holds up for one team running one project, and the steps below provide the exact columns and formulas, and then show where a spreadsheet stops being enough.
What you'll need before starting
Here's what to have ready:
-
A free Google account. Sheets itself doesn't add any extra cost.
-
The task list for one project, with an owner and a deadline for each task.
-
A Google work or school account, only if you want the conditional (rule-based) email notifications covered in the limits section.
Time required: About 15 minutes for the basic tracker, plus 15 to 20 minutes for the Gantt view and the dashboard.
To skip the build, copy this project management template, already set up with the task table, status dropdowns, Dashboard tab, and Gantt grid described below.
Google Sheets project management tracker columns
Every version of this tracker starts from the same seven columns. Keep Assignee to one person per task, which makes the filter views and per-person counts later in this guide work cleanly.
| Column | What it holds | Type |
|---|---|---|
| Task ID | A short code like T-001 | Text |
| Task name | One action, such as "Draft launch email" | Text |
| Status | To do, In progress, Blocked, Done | Dropdown |
| Priority | High, Medium, Low | Dropdown |
| Assignee | One person per task | Dropdown |
| Start date | The day work begins | Date |
| Deadline | The day the task is due | Date |
How to build the tracker in Google Sheets, step by step
Building the basic tracker takes four steps.
Step 1: Start with a table
Open a new sheet and click Insert > Pre-built table, then browse the sidebar for a project template. Rename or reorder its columns to match the seven above, in columns A to G, because the formulas and color rules below point at those letters.
To start from your own columns instead, type the seven headers from the table above in row 1, select them, and click Format > Convert to table. Google's tables help page explains how tables apply column types and warn you about entries that don't fit.
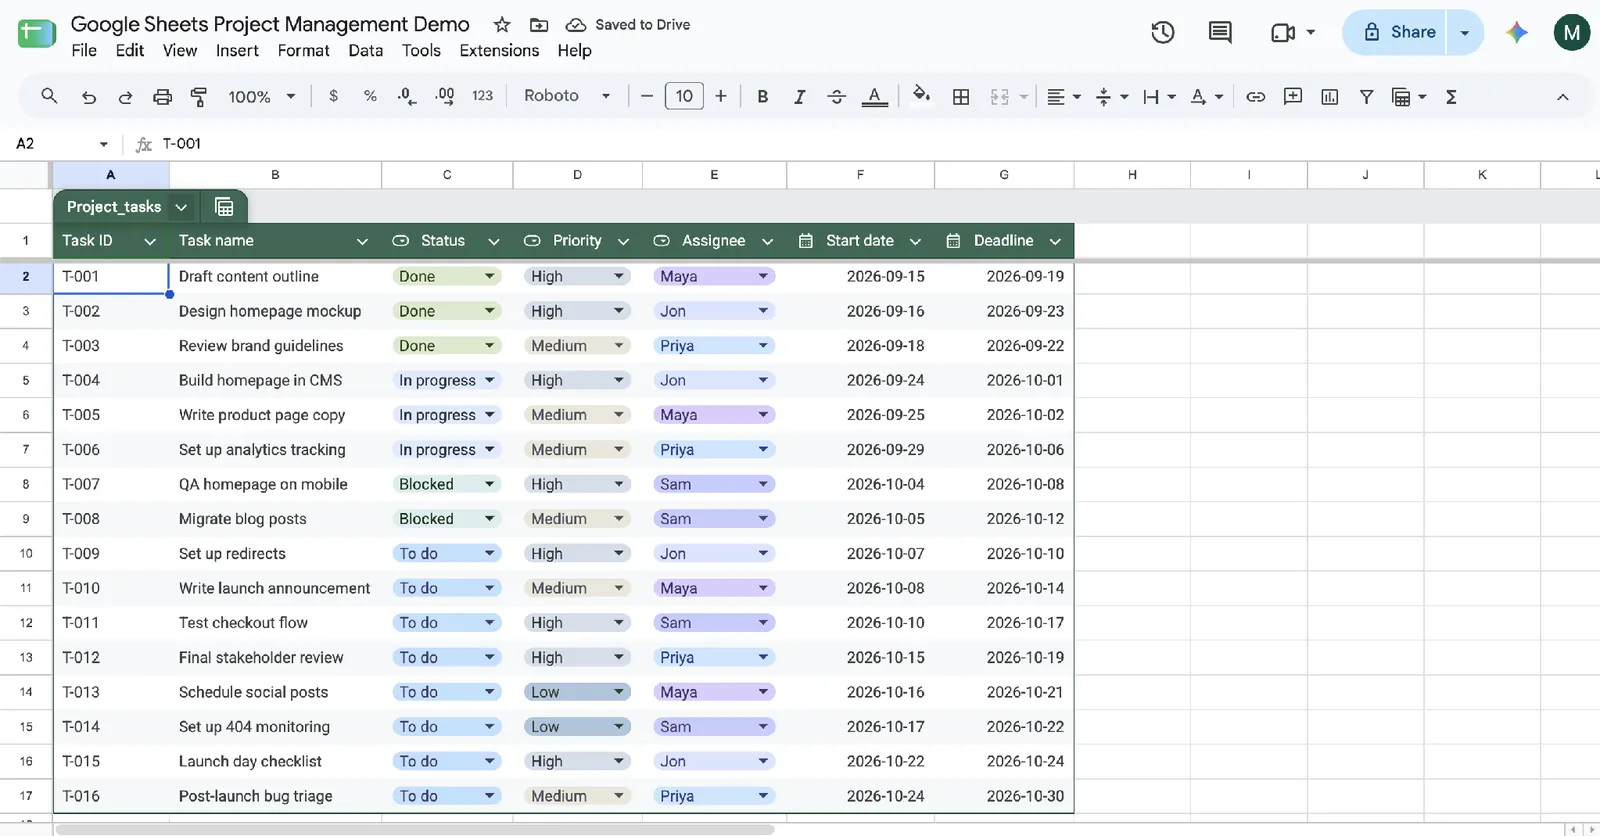
Pro tip: Give the table a short name such as Project_tasks from the table menu. The formulas later in this guide refer to it by name, and those references keep working as rows are added.
Step 2: Check the dropdowns and date columns
After converting, set the column types yourself: open the menu next to the Status header, click Edit column type, choose Dropdown, and add the options. Do the same for Priority and Assignee, and set Start date and Deadline to the Date type.
Status needs exactly four options: To do, In progress, Blocked, and Done, so add or remove options and adjust the colors until the list matches. Do the same for Priority (High, Medium, Low) and Assignee (your team's names).
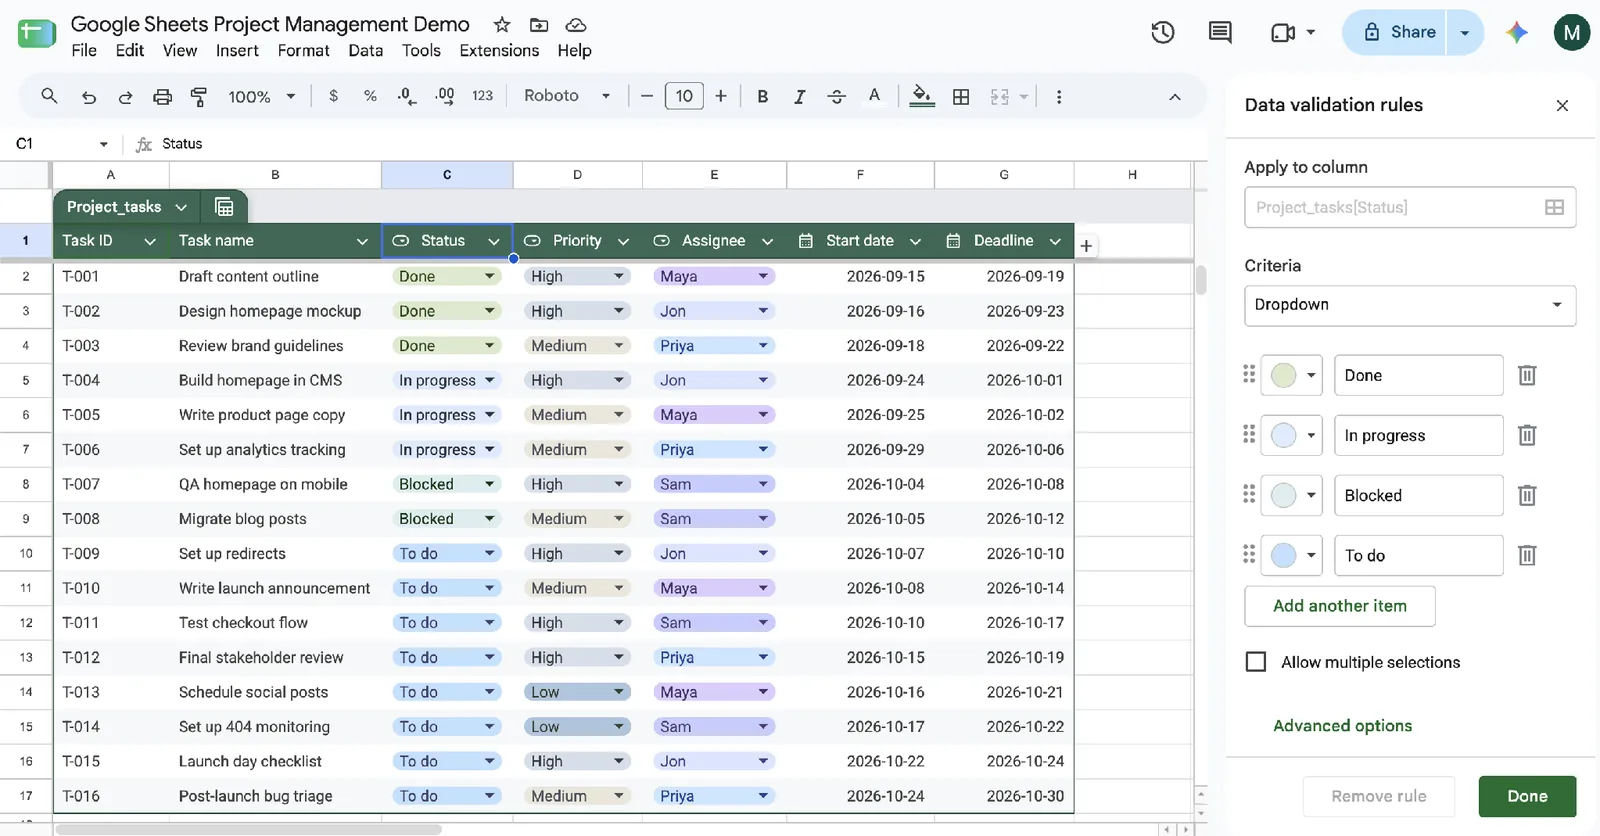
In a plain range instead of a table, select the column and click Data > Data validation > Add rule, then choose Dropdown as the criteria to build the same list from scratch. Google's project plan page walks through those steps, including how to give each option its own color.
A dropdown keeps "Done," "Done " with a stray space, and "Complete" from becoming three different statuses, and every formula in this guide depends on the exact word.
Pro tip: Keep Status to four values. More options make the dashboard counts harder to read and rarely change what anyone does next.
Step 3: Color each row by status
Select A2:G500, click Format > Conditional formatting, and choose Custom formula is under Format cells if. Add one rule for each status that needs a color, and leave To do white. Here are the three formulas:
-
=$C2="Done" with a grey fill.
-
=$C2="In progress" with a light yellow fill.
-
=$C2="Blocked" with a light red fill.
The dollar sign locks each rule to the Status column, so the whole row recolors as soon as the status changes. Google's conditional formatting page covers custom formulas in more detail.
Step 4: Enter the tasks, each with a permanent ID
Type T-001, T-002, and so on down the Task ID column, then fill in the rest of each row. Task names get reworded, and deadlines move, so treat the ID as the one thing that never changes. That permanence is what lets other tasks point to it in the dependency section below.
Pro tip: Enter a deadline for every task before you share the sheet. The overdue count on the dashboard skips any task that has none.
Formulas and views that make the tracker work
Add these four pieces to turn the basic tracker into something you can run a project from.
Flag tasks that are waiting on another task
A dependency means one task can't start until another is done. To the right of Deadline, add a column called Depends on and type the Task ID of the task that has to finish first. Then add a Ready? column next to it with this formula in row 2, and fill it down.
=IF(H2="","Ready",IF(XLOOKUP(H2,$A$2:$A,$C$2:$C,"")="Done","Ready","Waiting"))The formula looks up the first task's status and shows Waiting until it reads Done. Google documents the XLOOKUP function on its help page.
This flags a stuck task but reschedules nothing. If the first task slips a week, you still edit each later start date by hand, which is the first limit covered further down.
Percent done and overdue counts
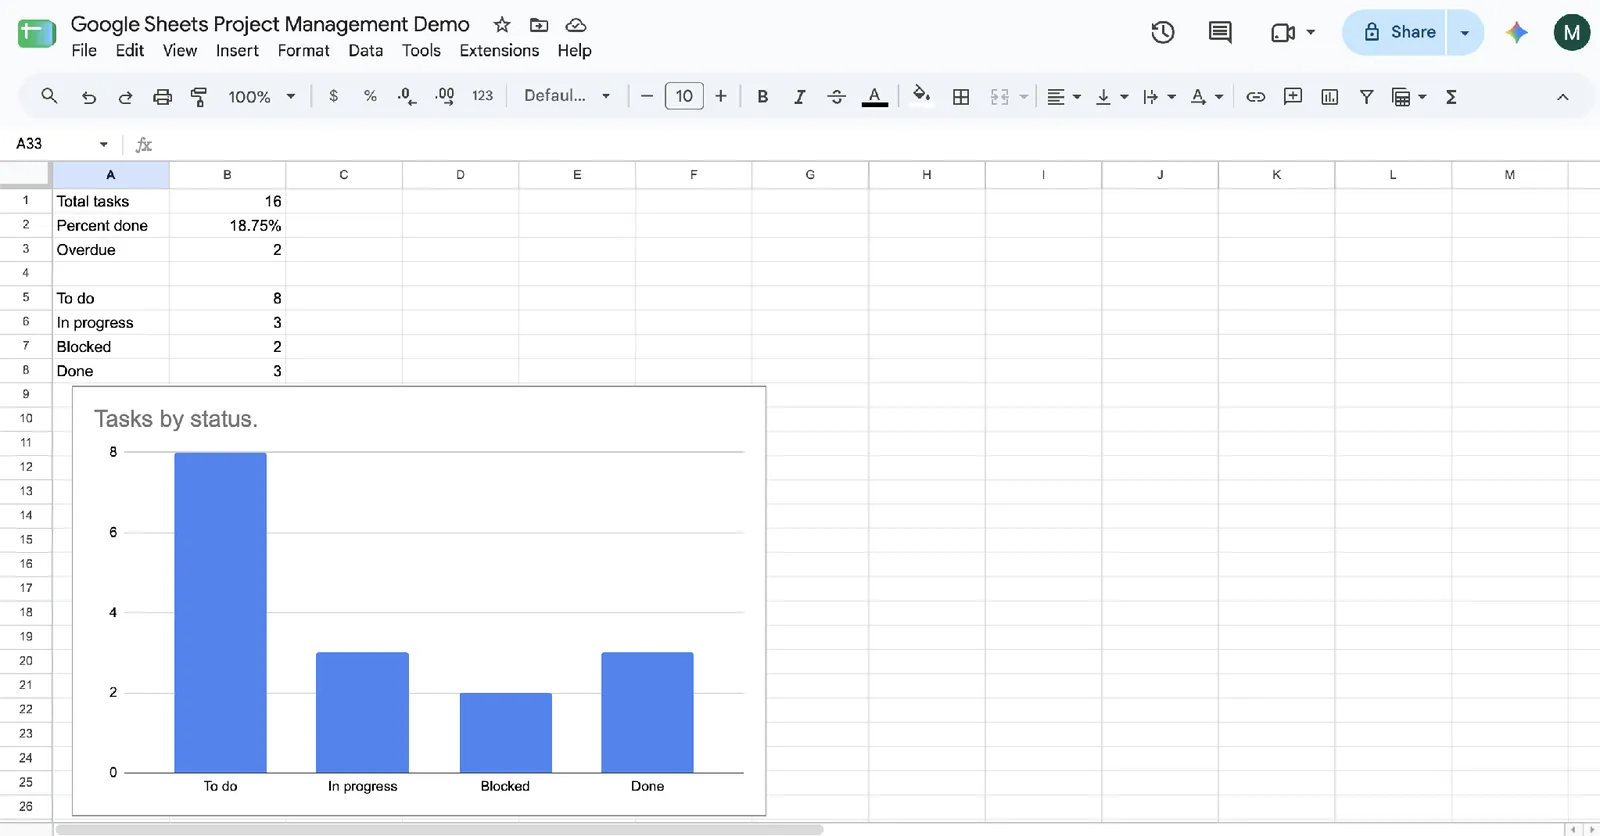
Add a tab called Dashboard. The formulas on it use the table name from Step 1, so they keep counting as you add rows. Here are the three formulas to enter:
-
Total tasks: =COUNTA(Project_tasks[Task name]).
-
Percent done: =IFERROR(COUNTIF(Project_tasks[Status],"Done")/COUNTA(Project_tasks[Task name]),0).
-
Overdue tasks: =COUNTIFS(Project_tasks[Deadline],"<"&TODAY(),Project_tasks[Status],"<>Done").
Format the percent cell as a percentage. The overdue formula counts tasks with a deadline before today that aren't marked Done, and Google's COUNTIFS page explains how the paired conditions work.
Filter views for each assignee
A regular filter is visible to everyone with access to the sheet, and anyone who can edit can change it. A filter view applies only to the person using it, so each assignee can look at their own tasks without disturbing anyone else.
Create one from the table's Views menu with Create filter view, or, in a plain range, from Data > Create filter view. Google's sort and filter page covers saving and sharing them, and a group by view in the same menu can summarize the table by assignee.
A dashboard tab
On the same Dashboard tab, list the four statuses in a column and put =COUNTIF(Project_tasks[Status],A5) beside each one, adjusting the cell reference to wherever the label sits.
Select both columns and click Insert > Chart for a status breakdown, then place the percent-done figure and the overdue count above the chart so the headline numbers share one screen.
For more ideas on what belongs on that tab, see this operations dashboard template.
Four tracker variants to build from the same table
Basic task tracker
The seven-column table from the steps above is the basic version. It suits one team and one project, where the main questions are who owns what and what's late.
Gantt view
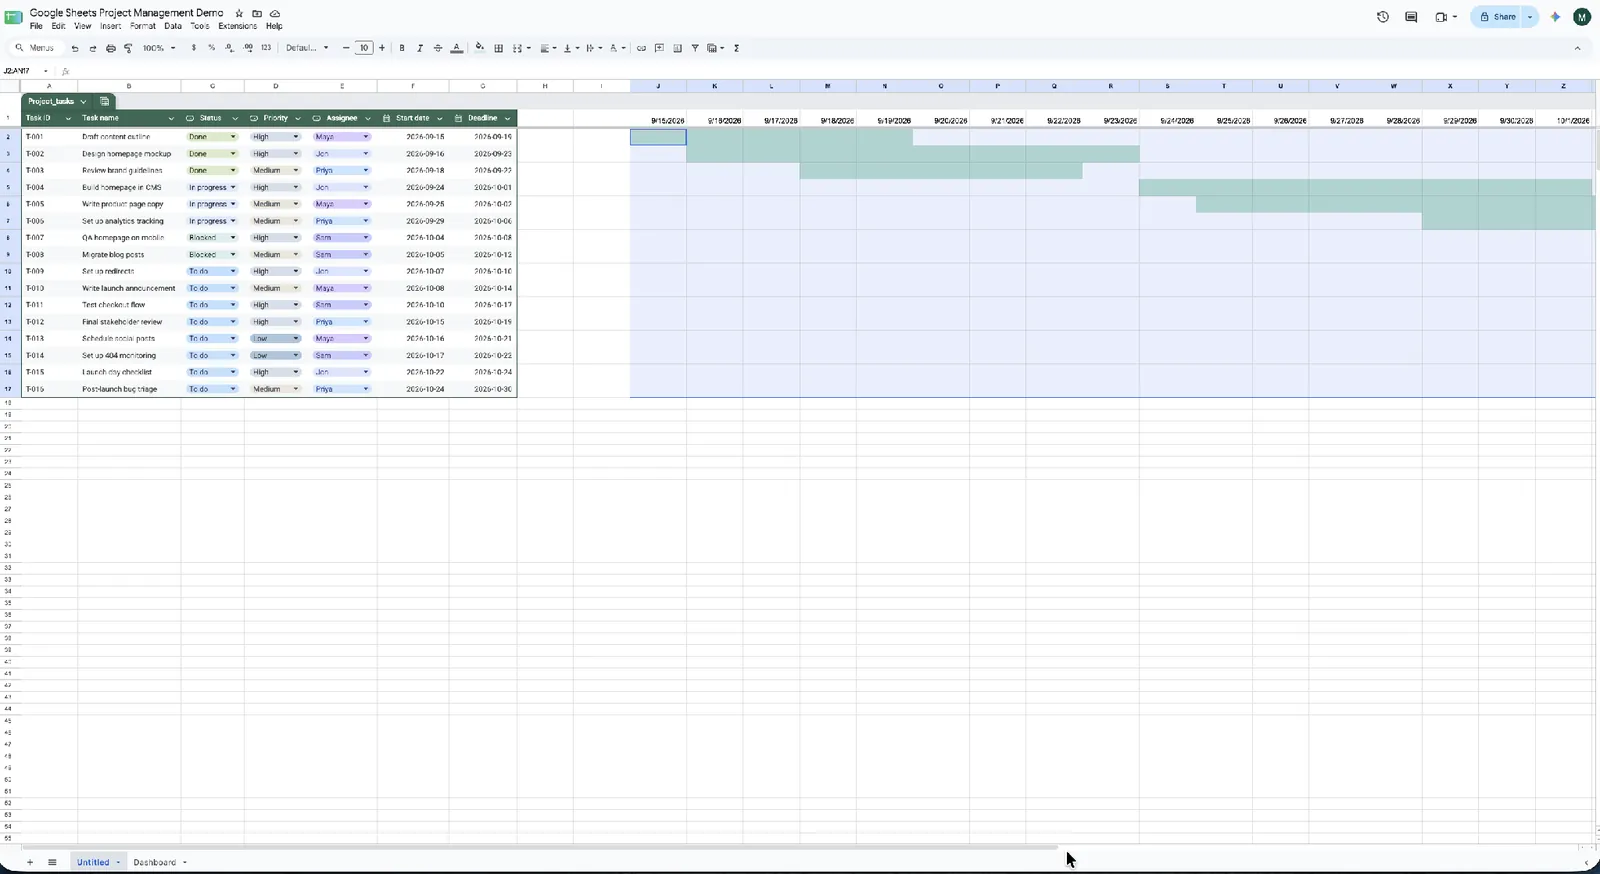
A Gantt view shows each task as a bar across a calendar, and in Sheets you can build it as a color grid beside the table using only conditional formatting. Here are the three steps:
1. In cell J1, enter =MIN(Project_tasks[Start date]). In K1, enter =J1+1 and fill it right to column BQ, which gives one column per day for 60 days.
2. Select J2:BQ200 and add a conditional formatting rule the way you did in Step 3.
3. Enter =AND(J$1>=$F2,J$1<=$G2) as the custom formula and pick a fill color.
Each cell lights up when its date falls between the task's start date and deadline, so editing a date moves the bar. Format row 1 as dates and narrow the columns, then extend the date row for longer projects. The grid draws no dependency arrows.
Sprint board
Add Sprint and Points columns to the table. On a new tab named Board, type To do, In progress, Blocked, and Done across A1 to D1, and add a dropdown in F1 listing your sprint names. Then put this formula in A2 and fill it across to D2.
=IFERROR(FILTER(Project_tasks[Task name],Project_tasks[Status]=A$1,Project_tasks[Sprint]=$F$1),"")Each column lists the tasks in that status for the selected sprint, and FILTER fills downward as needed. Total the sprint's points with =SUMIFS(Project_tasks[Points],Project_tasks[Sprint],F1).
Multi-project rollup
Track several projects at once by adding a Project column to the table, then a Rollup tab with one project name per row in column A. Enter these three formulas in the next three columns:
-
Tasks: =COUNTIF(Project_tasks[Project],A2).
-
Percent done: =IFERROR(COUNTIFS(Project_tasks[Project],A2,Project_tasks[Status],"Done")/COUNTIF(Project_tasks[Project],A2),0).
-
Overdue: =COUNTIFS(Project_tasks[Project],A2,Project_tasks[Deadline],"<"&TODAY(),Project_tasks[Status],"<>Done").
If each team already keeps its own file, pull their status column in with IMPORTRANGE instead, for example, =COUNTIF(IMPORTRANGE("FILE_URL","Tasks!C2:C"),"Done"). Sheets asks you to grant permission the first time a file is connected.
Once the rollup becomes the page leadership checks every week, this roundup of custom dashboard software covers tools built for that job.
Common mistakes to avoid
The same mistakes come up again and again:
-
Typing statuses by hand: Free-typed entries break every count and color rule that expects an exact match, so use the dropdown from Step 2.
-
Filtering the shared view: A regular filter changes what everyone sees, so give each assignee a filter view instead.
-
Putting the dashboard on the task tab: Charts and counts placed beside the table share its rows, so inserting or deleting a row moves them too, and a separate Dashboard tab keeps them in place.
-
Waiting too long to move off Sheets: A tracker that needs reminders, per-person views, and several editors is already asking for a database, and this roundup of no-code app builders with databases shows what the next step looks like.
Where Google Sheets project management runs out of room
The tracker above covers a lot, and four limits mark where it stops.
Dependencies: The Ready? flag shows what's waiting, but nothing reschedules later tasks when one slips, so every downstream start date stays a manual edit.
Notifications: Google's conditional notifications email people when a cell changes, and they are limited to certain work or school accounts. They don't support group addresses or non-Google recipients such as Outlook and Yahoo, and Google notes that the emails may not be immediate.
Pre-built project tables include a rule such as "Send email when project task owner changes," switched off until you enable it. I wouldn't count on any of this to catch a deadline slipping past unannounced.
Shared editing: When several people work in one file, one person's sort, paste, or deleted row changes the tracker for everyone. Tables flag entries that don't fit a column type, but they can't stop a teammate from overwriting a column of good data.
Permissions: Everyone you share the sheet with can see all of it. You can restrict who edits a sheet or range, but Google's help page says protection shouldn't be used as a security measure, because people can copy and export a protected spreadsheet.
A filter view narrows what someone looks at, while the rest of the sheet stays one click away.
If two or more of these are weekly problems, this guide to Google Sheets alternatives for business databases compares the options.
How Zite handles the four limits
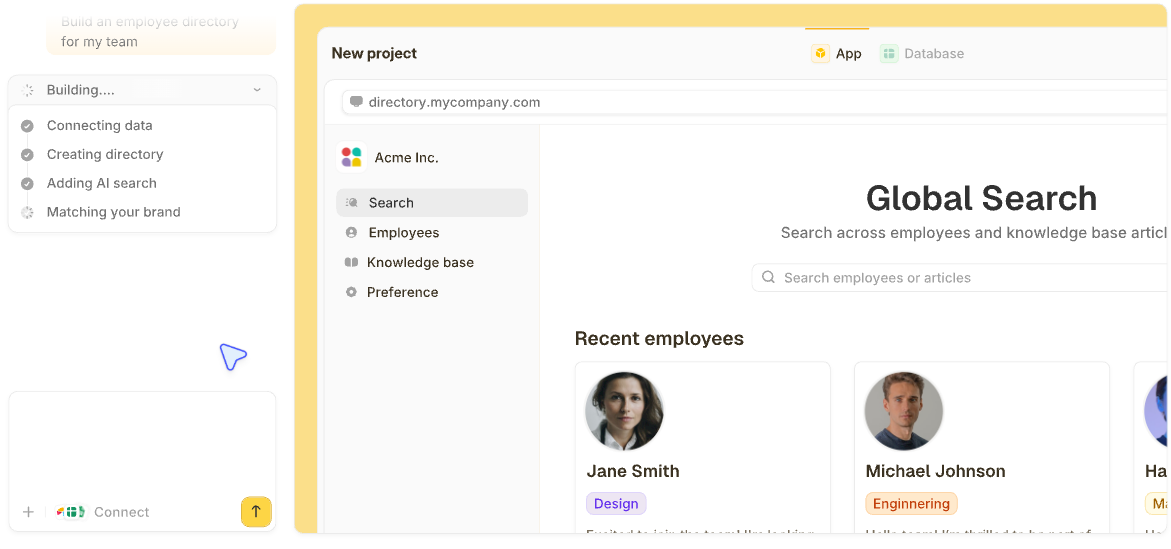
Zite can build the whole project tracker as an app from a description of how your team works: a status board, a task list for each person, a timeline, and a dashboard with percent done and overdue counts.
The app can run on the Google Sheet behind this tracker, reading and updating it directly so your team can keep using either one. Or you can import the sheet into Zite's own database and review the tables, field names, and field types before confirming.
Here's what each of the four limits looks like from there:
- Dependencies as links: Linked record fields connect a task to the task it waits on, and a lookup field pulls that task's status in, so the link survives renamed tasks and re-sorted rows.
You can also describe a rule such as "when someone moves a task's deadline in the app, push back every task that depends on it by the same number of days," and Zite builds the workflow that does it. Zite's database page lists linked record, lookup, and rollup among its field types.
-
Reminders on a schedule: Describe a workflow such as "every Monday at 9:00, email each assignee their open tasks." Zite writes the steps; you can read and test them before they go live, and you change the workflow by describing the change. Workflows can start on a schedule (Business plan and up) and send email through Gmail, Outlook, or SMTP.
-
Rollback after edit mistakes: Zite's undo can roll your data back to a specific minute and preview the result before you commit, which helps when a bulk edit overwrites a column of tasks.
-
Each person sees their own tasks: Ask for it, for example, "only show each person the tasks assigned to them," and everyone signs in to just their own list, on every plan including Free.
On the Team plan, you can also add roles, such as a manager role, by describing what that kind of person can and can't do. This guide to a no-code client dashboard applies the same idea to outside stakeholders.
The Gantt grid and the filter views from earlier both have a counterpart here. Ask for a timeline view, and Zite can draw each task as a bar from its start date to its deadline, and a task list for each person replaces the filter views.
Zite is free to start, with unlimited users, 50 credits/month, and up to 5,000 database records. Paid plans start at $25/month for Pro, with 100 credits and 100,000 database records. Business runs $89/month, with 400 credits and 250,000 database records, plus advanced AI models.
Frequently asked questions
Does Google have a free project management tool?
Yes, Google has a free project management tool in Google Sheets, open to anyone with a Google account. Sheets includes pre-built project tables under Insert > Pre-built table, and Google's Learning Center has a guide to building project plans in it.
Can you use Google Sheets for project management?
Yes, you can use Google Sheets for project management on a single team and project, using a task table with status dropdowns and filter views. It falls short on rescheduling dependent tasks, reminders, shared editing, and per-person access, which are the four limits covered above.
What is the best project management template for Google Sheets?
The best project management template for Google Sheets to start from is Google's own Insert > Pre-built table feature, which has status and date columns already set up. Start with Google's pre-built table for a quick list, or pick the template linked near the top of this guide if you want the dashboard and Gantt grid already built.
How do you create a project tracker in Google Sheets?
You can create a project tracker in Google Sheets by converting seven columns to a table, setting Status and Priority as dropdowns, coloring rows with conditional formatting, and entering each task with a permanent ID. The four steps above take about 15 minutes.
Can Zite replace a Google Sheets project tracker?
Yes, Zite can replace a Google Sheets project tracker with an app built from a description, including a status board, a timeline, a task list for each person, and email reminders (scheduled ones need the Business plan). It can keep reading and updating the existing sheet, or you can move the tasks into Zite's own database.