
A sales dashboard turns scattered numbers in a CRM into something a team looks at daily. Pipeline value, quota attainment, and where a deal is stuck all sit in one view instead of a weekly export nobody opens.
Here are 9 sales dashboard examples covering the situations that come up most, the KPIs each one tracks, and 5 tools to build your own. Every example below was built in Zite, so each screenshot shows a working dashboard.
What is a sales dashboard?
A sales dashboard is a live view of sales metrics, usually pulled from a CRM or spreadsheet, that shows a team or a leader how sales activity and revenue are trending without pulling a manual report.
The metrics differ by who's looking. A rep wants their own pipeline and activity. A sales manager wants team performance and forecast accuracy. Leadership wants revenue against target. The dashboard shape follows from that audience, which is why "sales dashboard" covers several distinct layouts instead of one standard template.
9 examples of sales dashboards
1. Sales pipeline dashboard
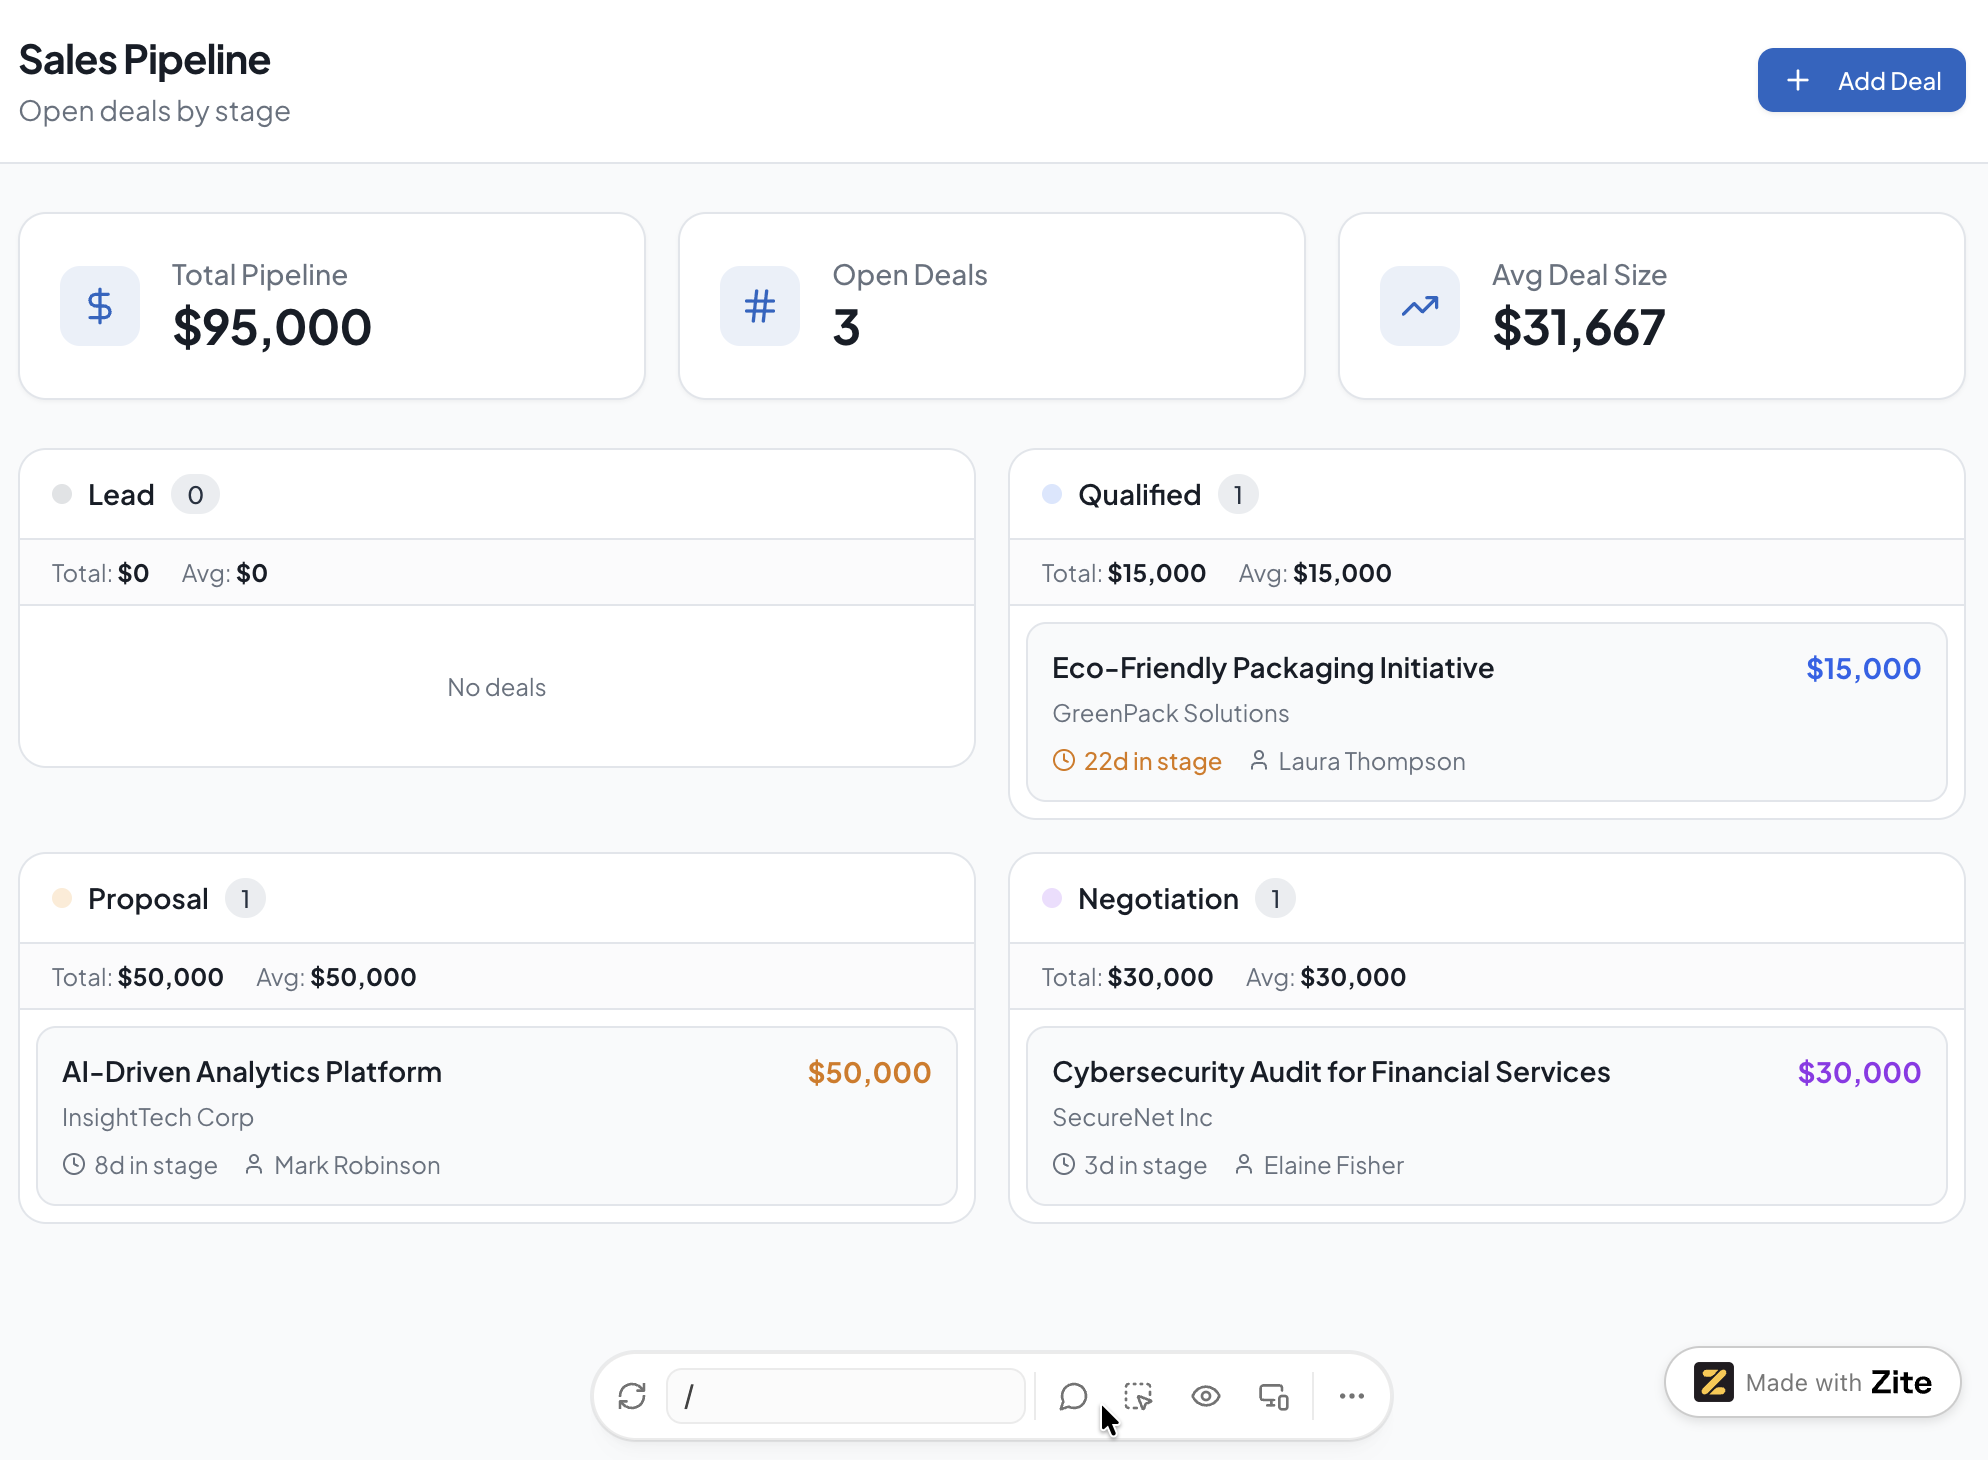
Tracks every open deal by stage, value, and expected close date, useful for spotting where deals are stuck before they go cold.
Key metrics: Deals by stage, total pipeline value, average deal size, days in stage.
2. Rep performance dashboard
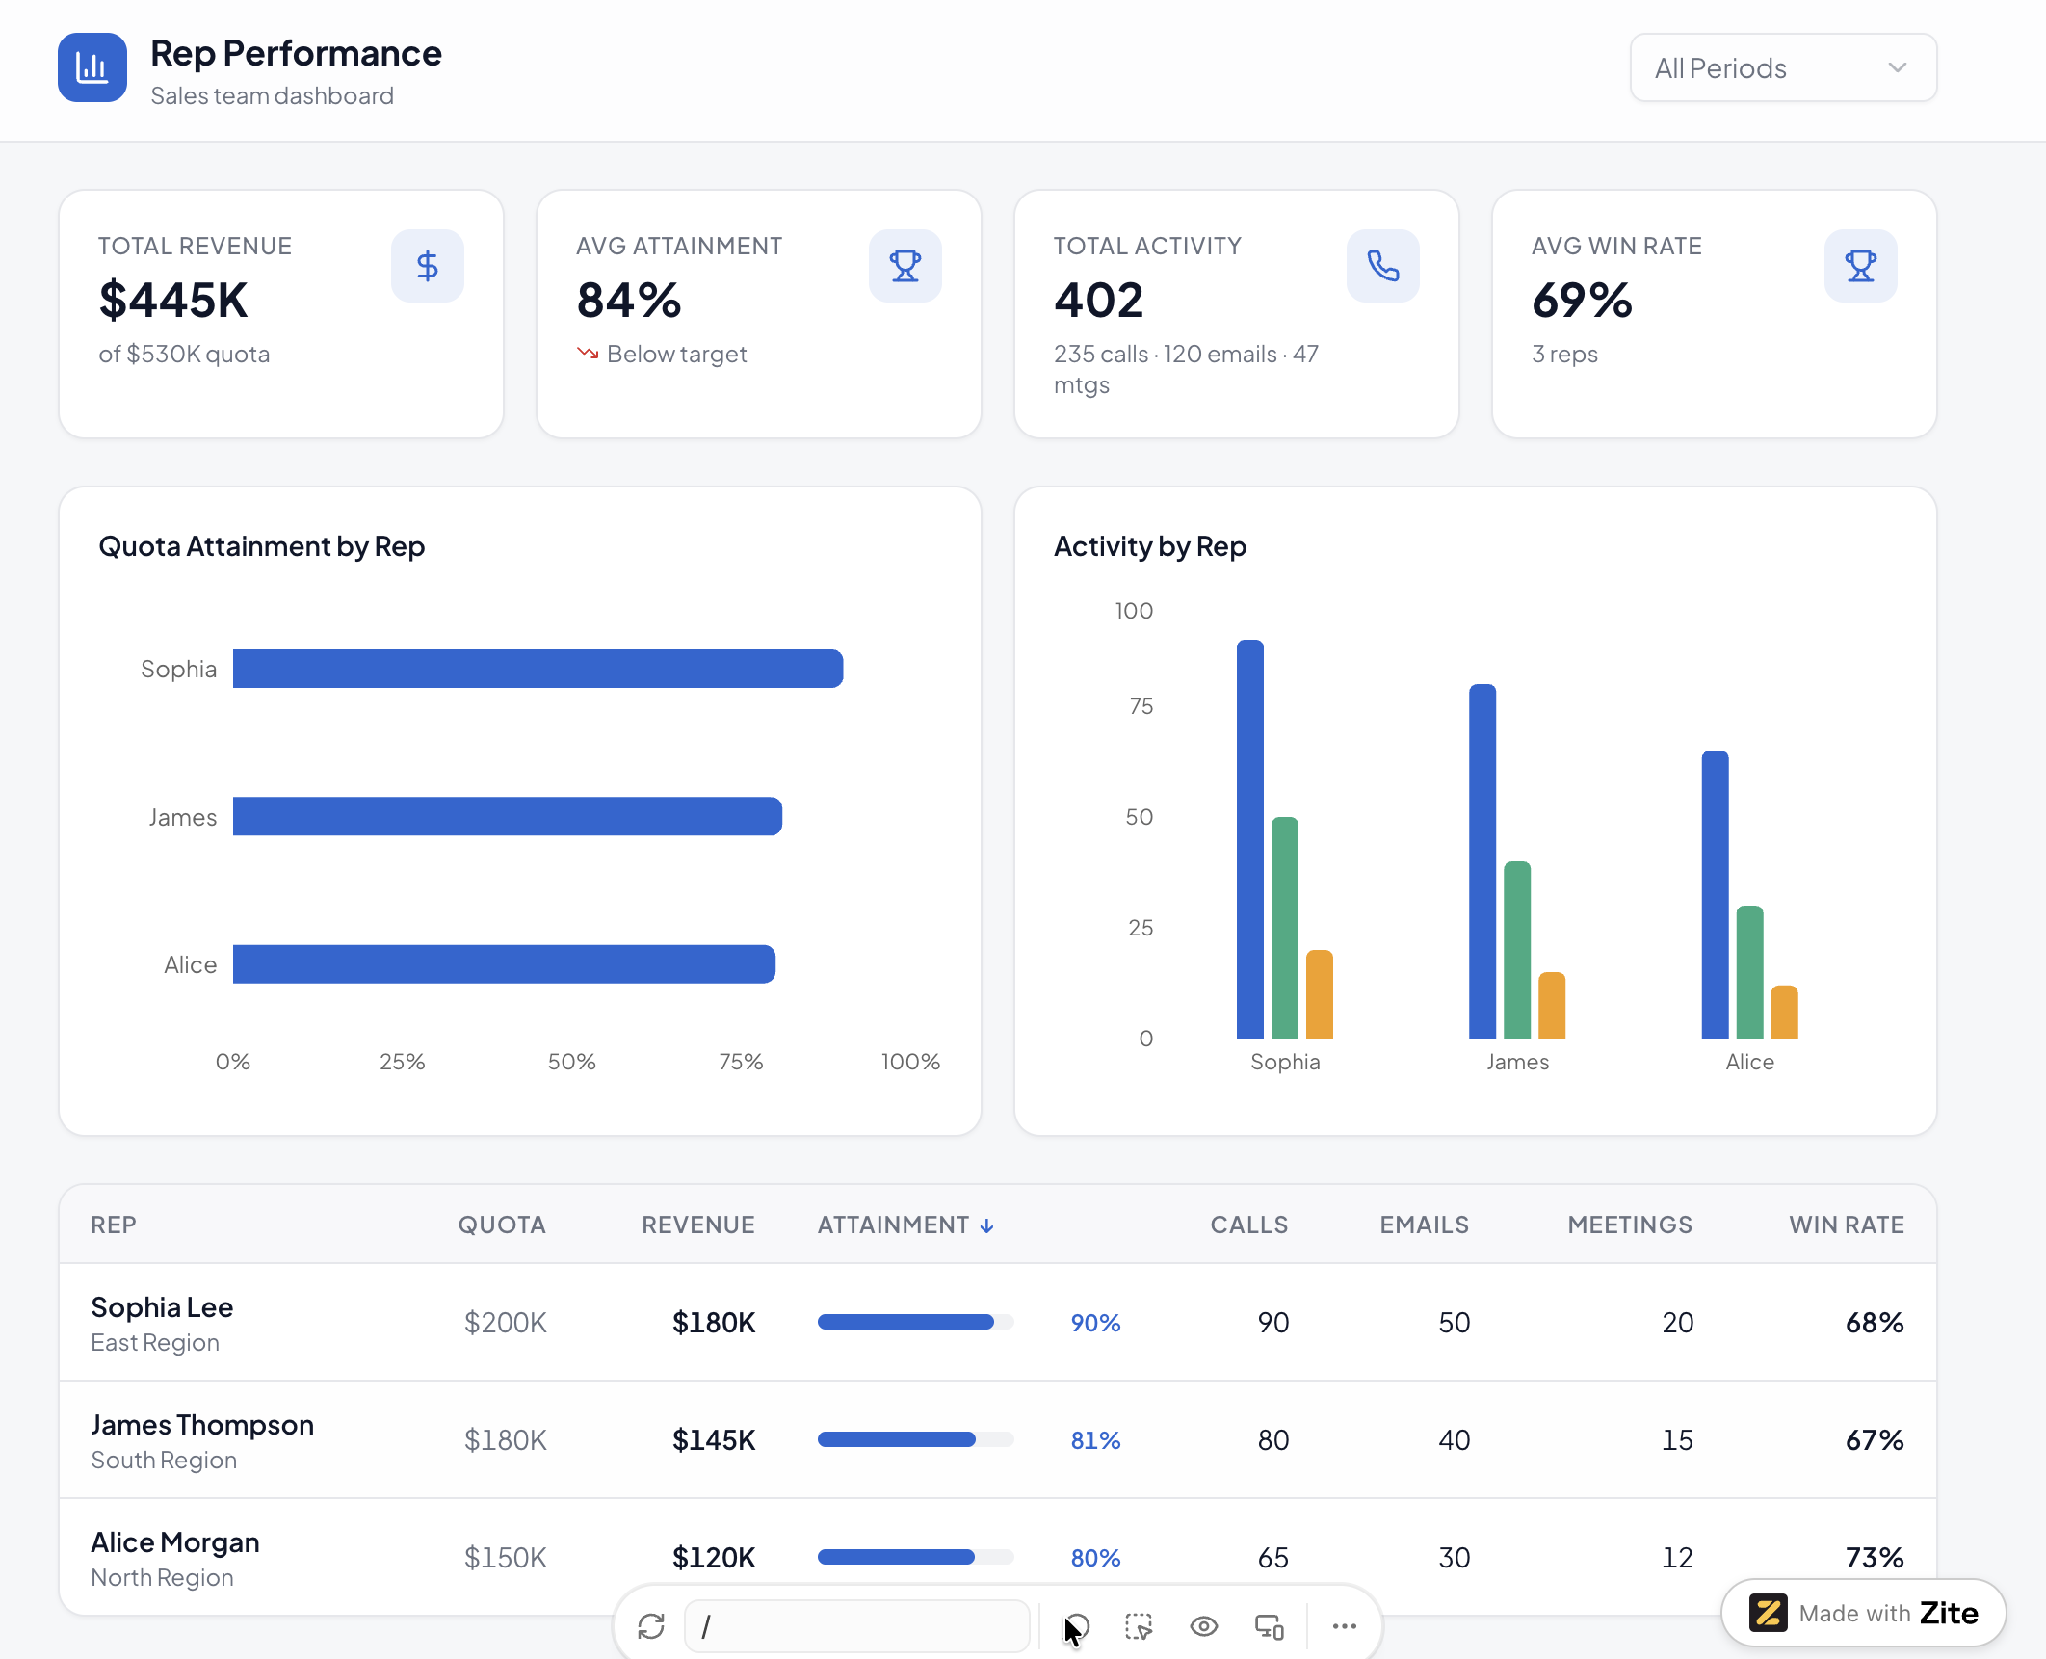
Compares individual rep activity and results against quota, useful for one-on-ones and for spotting a rep who needs coaching before the quarter ends.
Key metrics: Quota attainment, calls and emails logged, meetings booked, win rate per rep.
3. Sales forecast dashboard
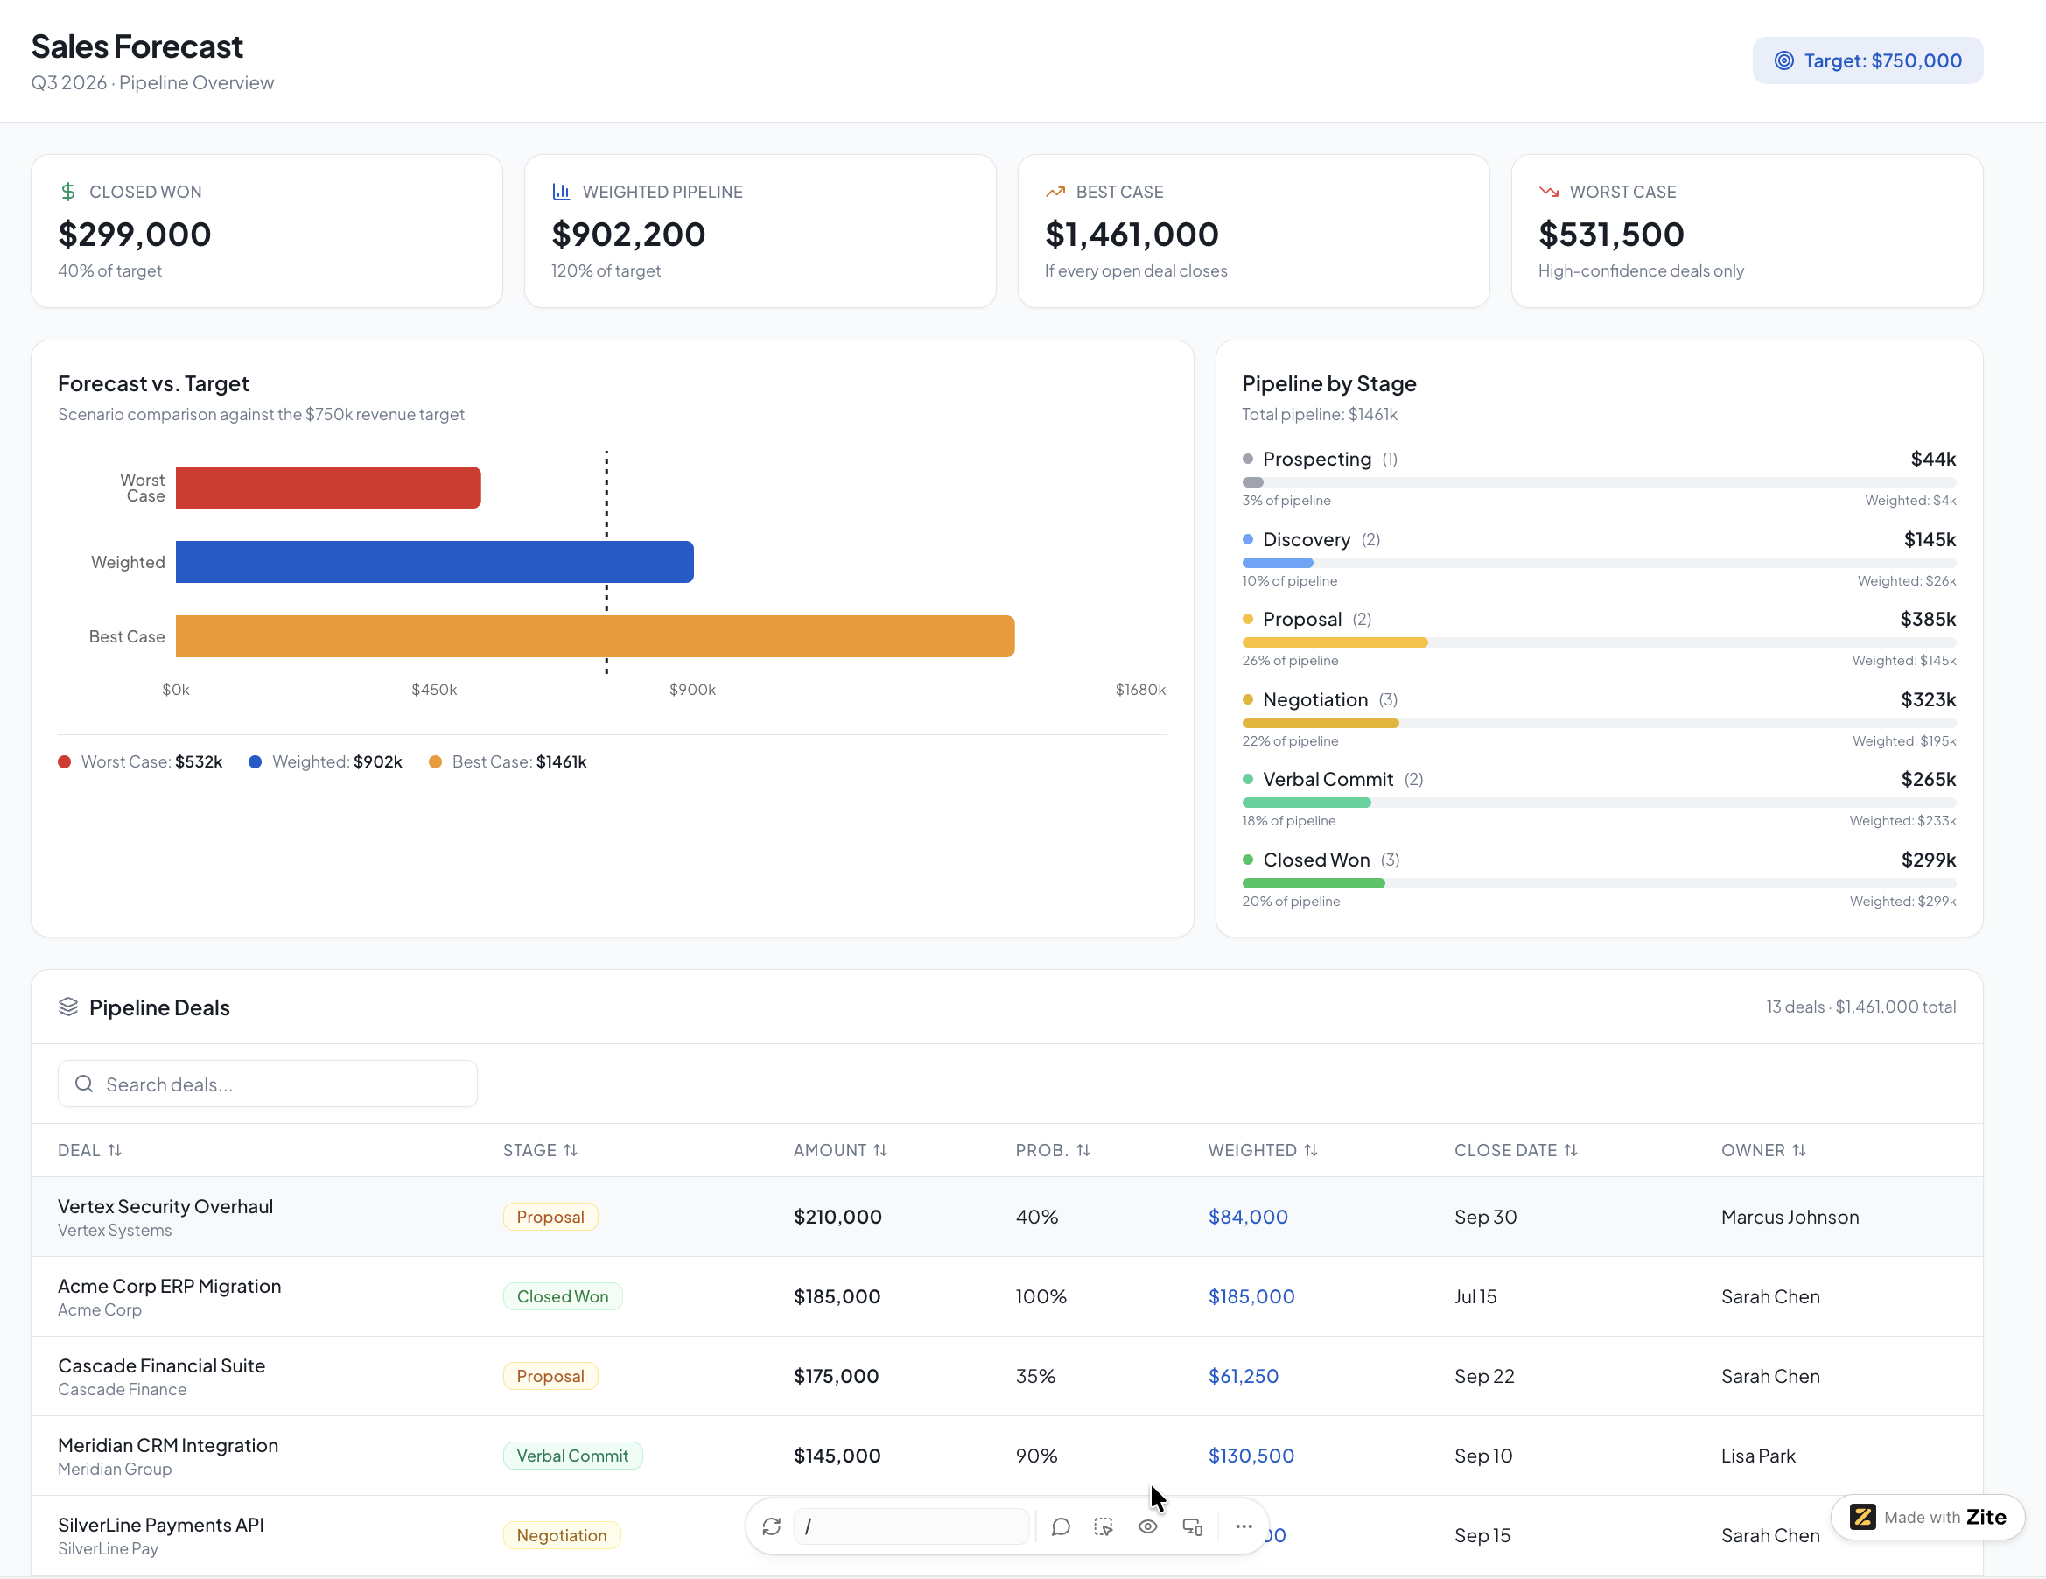
Projects revenue for the current period based on weighted pipeline value, useful for leadership tracking where the quarter is trending before it closes.
Key metrics: Weighted pipeline, forecast vs. target, best-case and worst-case scenarios.
4. Win-loss dashboard
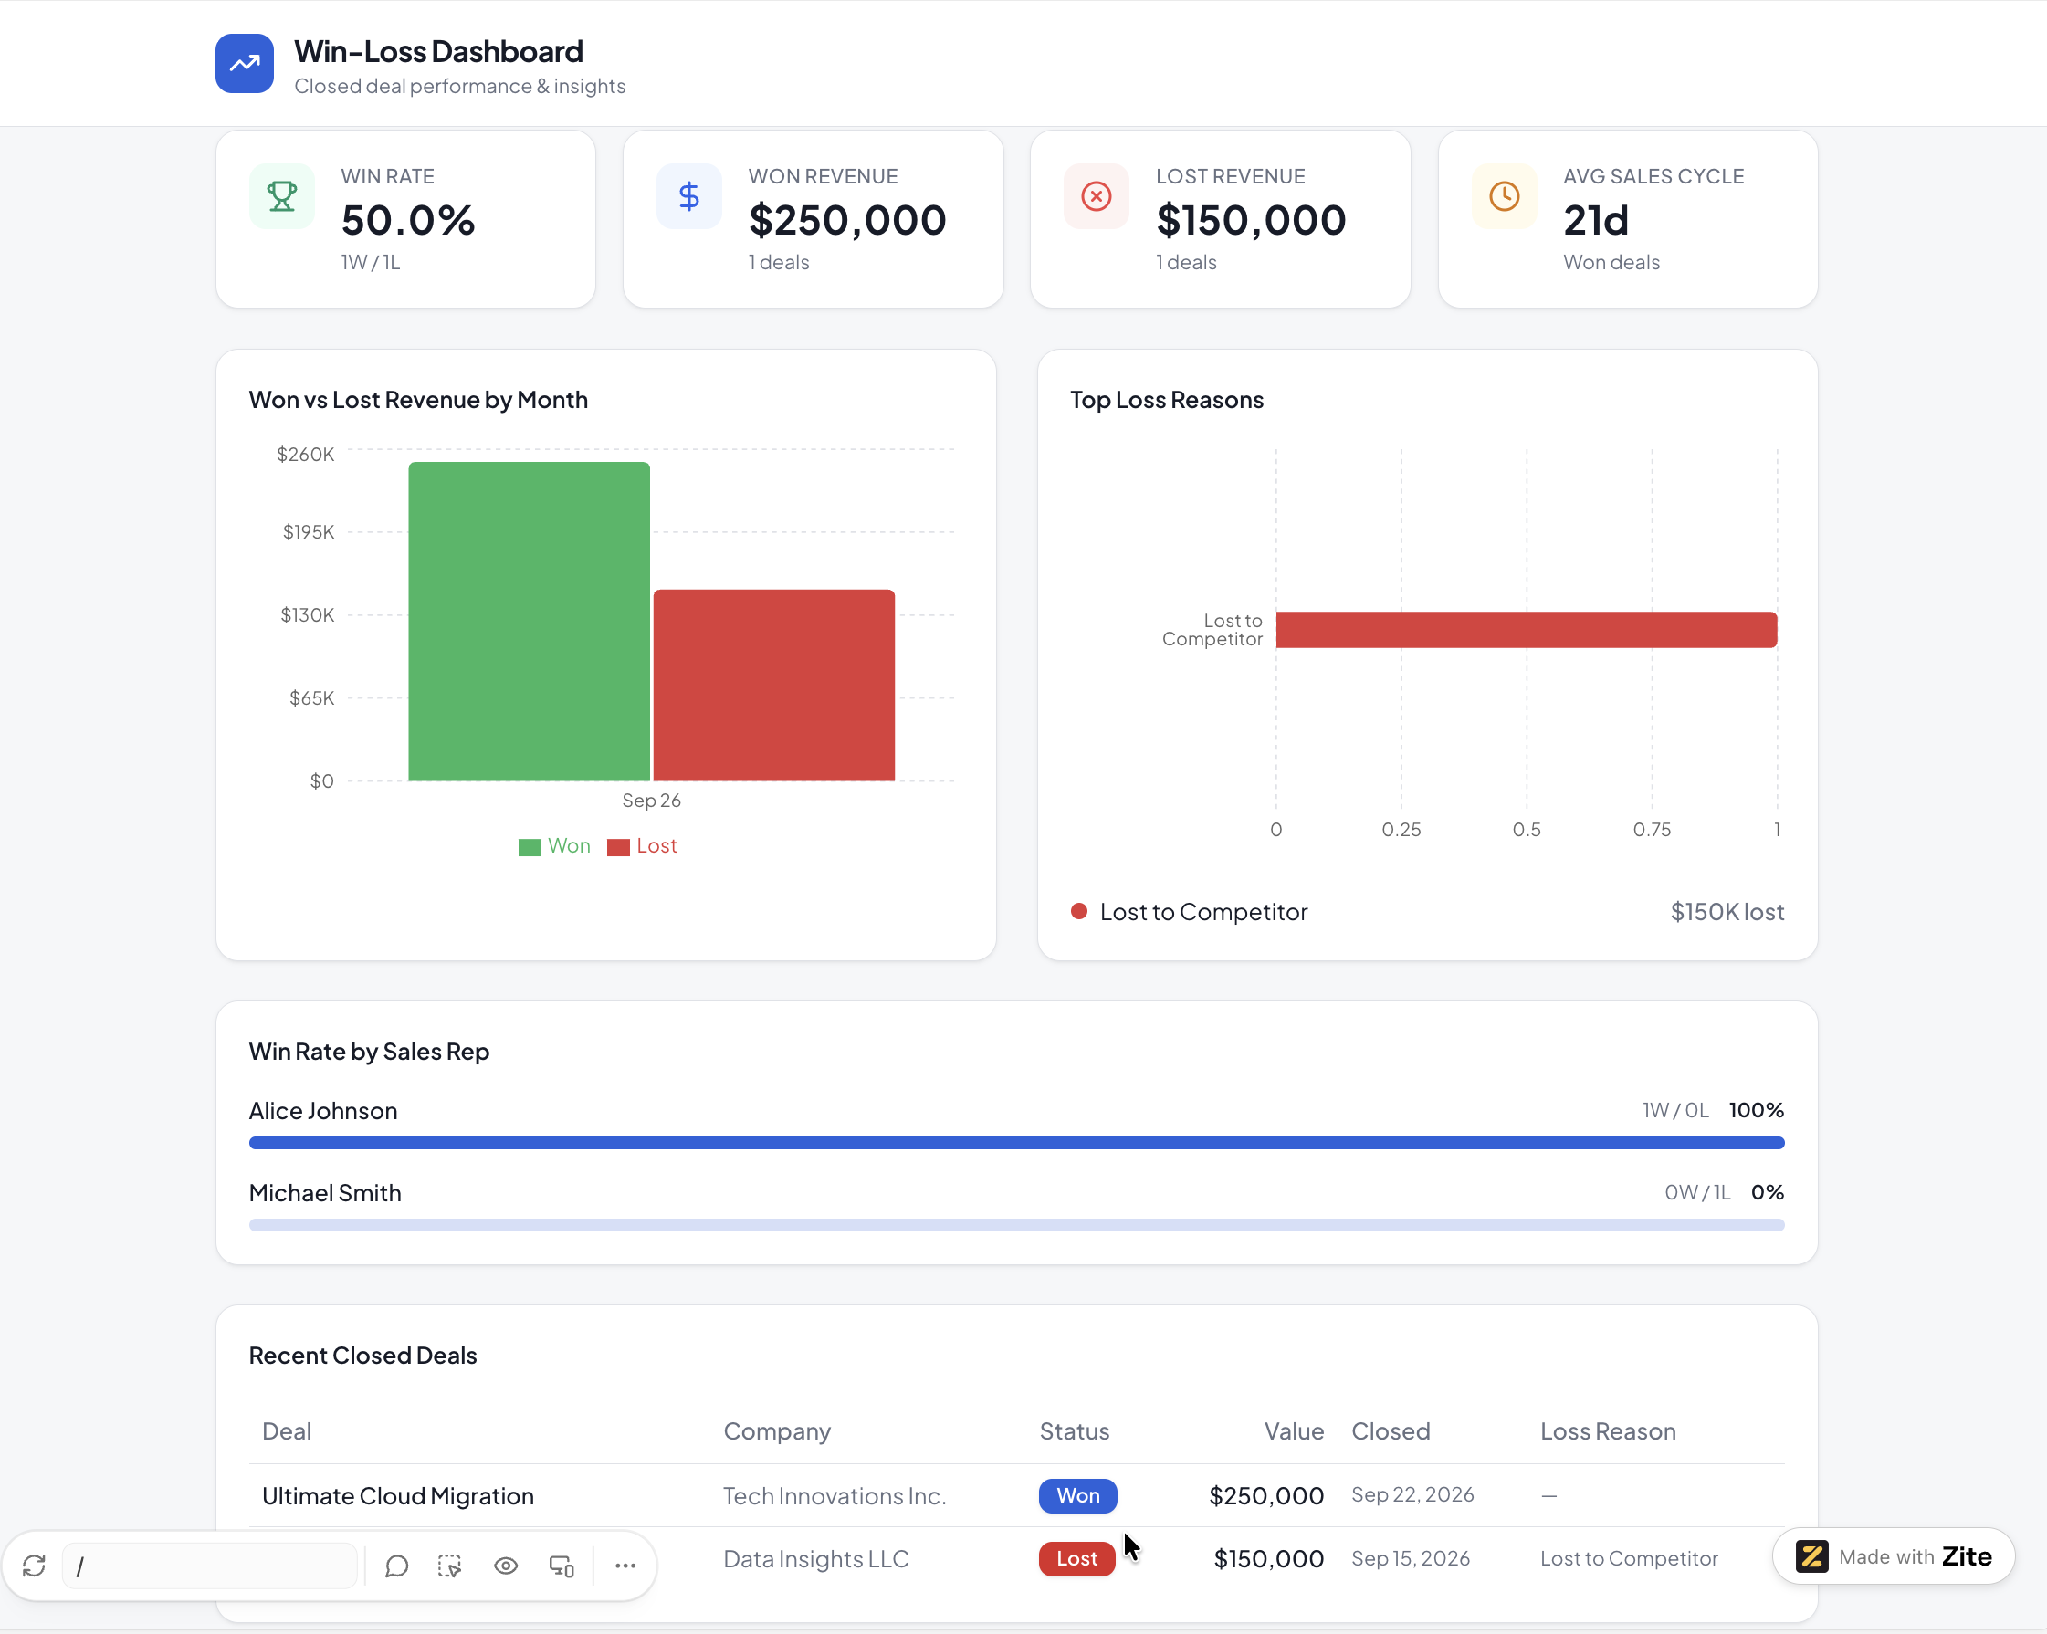
Breaks down closed deals by outcome, surfacing patterns in why deals are won or lost that a raw pipeline view doesn't show; useful for sales leaders refining what to prioritize in coaching and messaging.
Key metrics: Win rate by segment, top loss reasons, average sales cycle length for won deals.
5. Territory or region dashboard
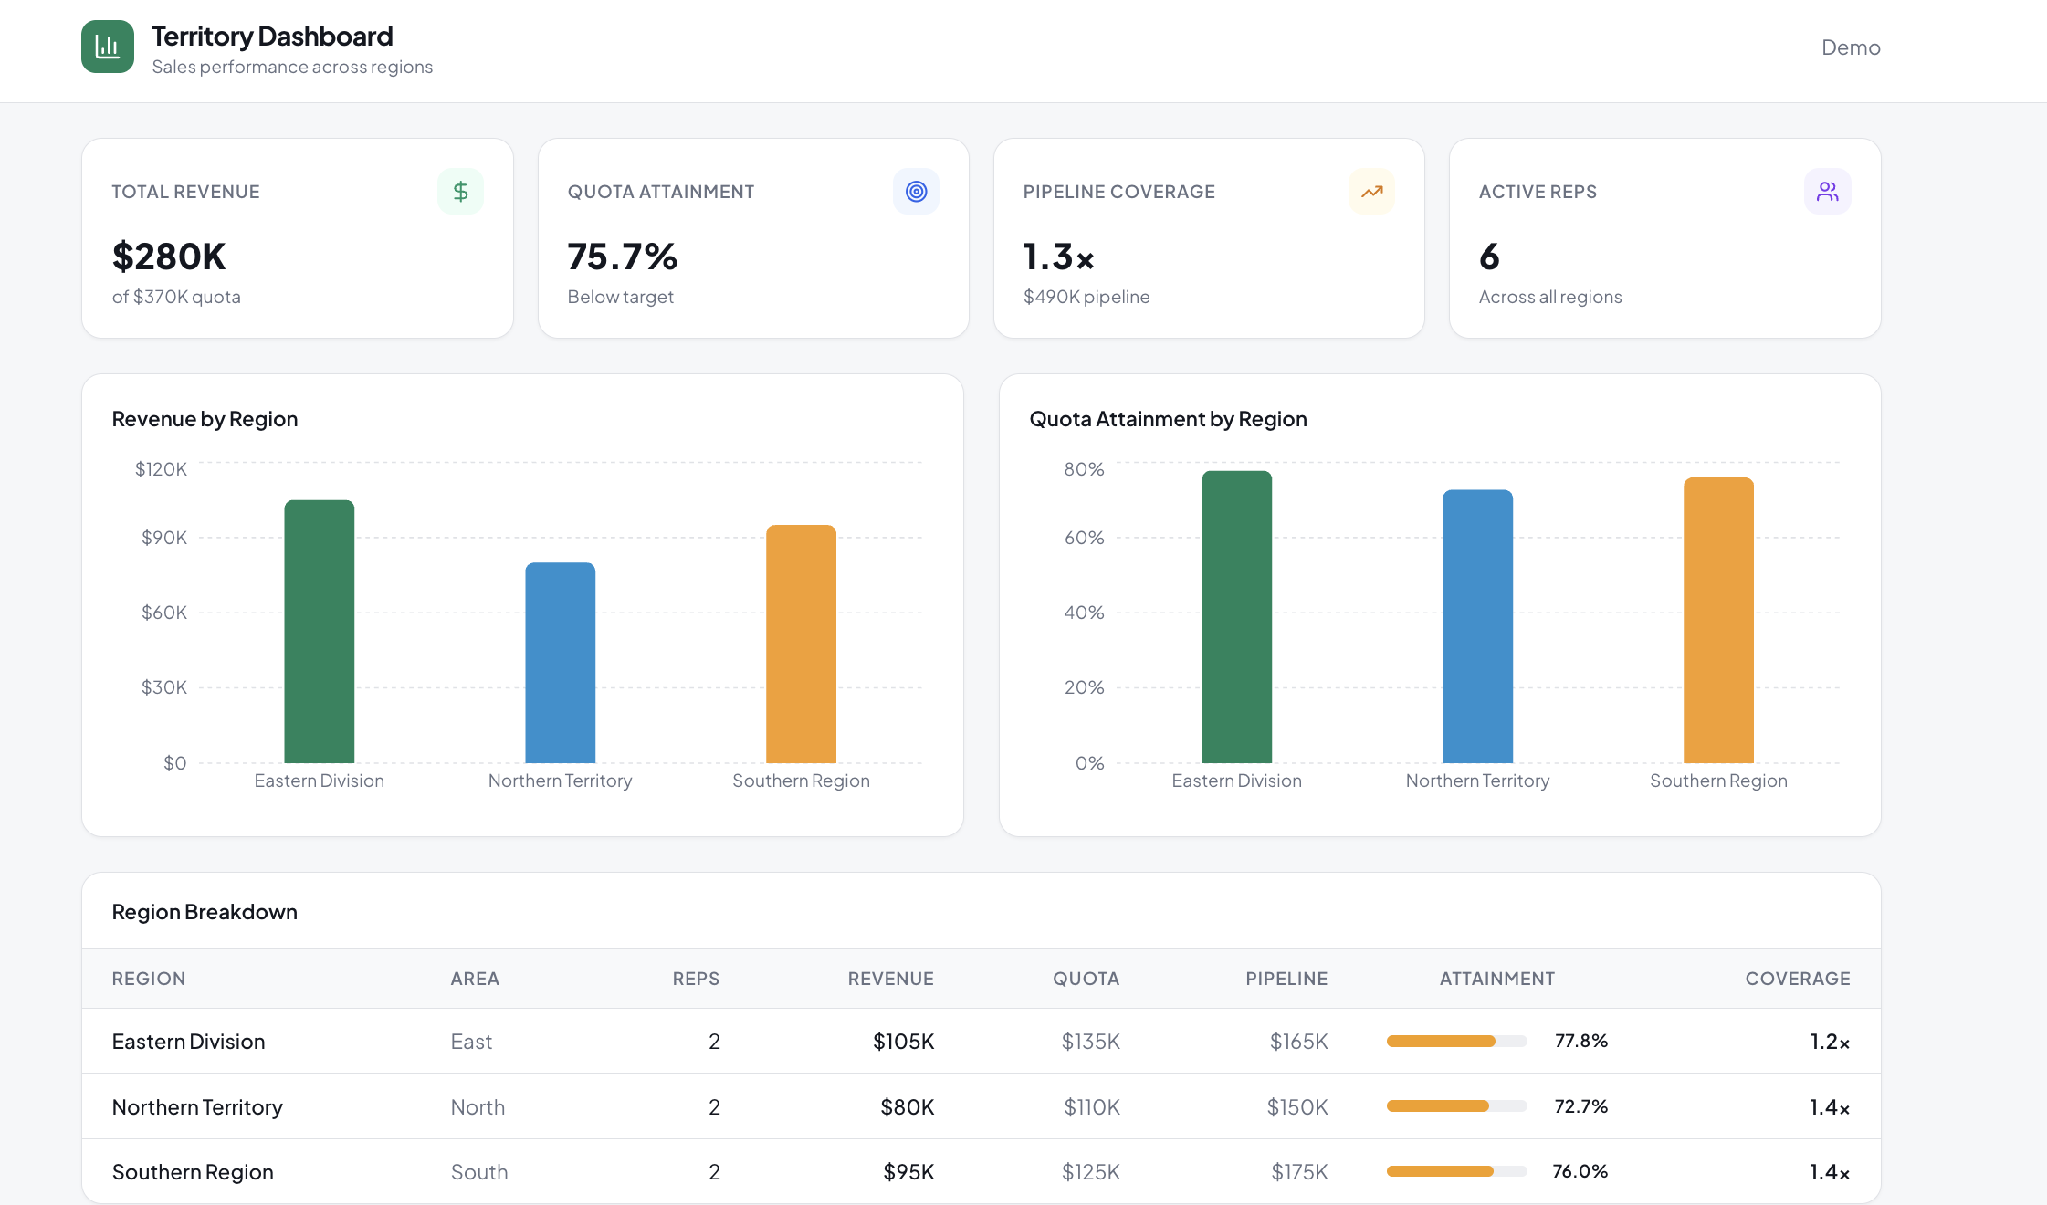
Compares performance across geographic or account-based territories, useful for organizations with regional sales teams or account assignments.
Key metrics: Revenue by territory, pipeline coverage per rep, quota attainment by region.
6. Lead source and funnel dashboard
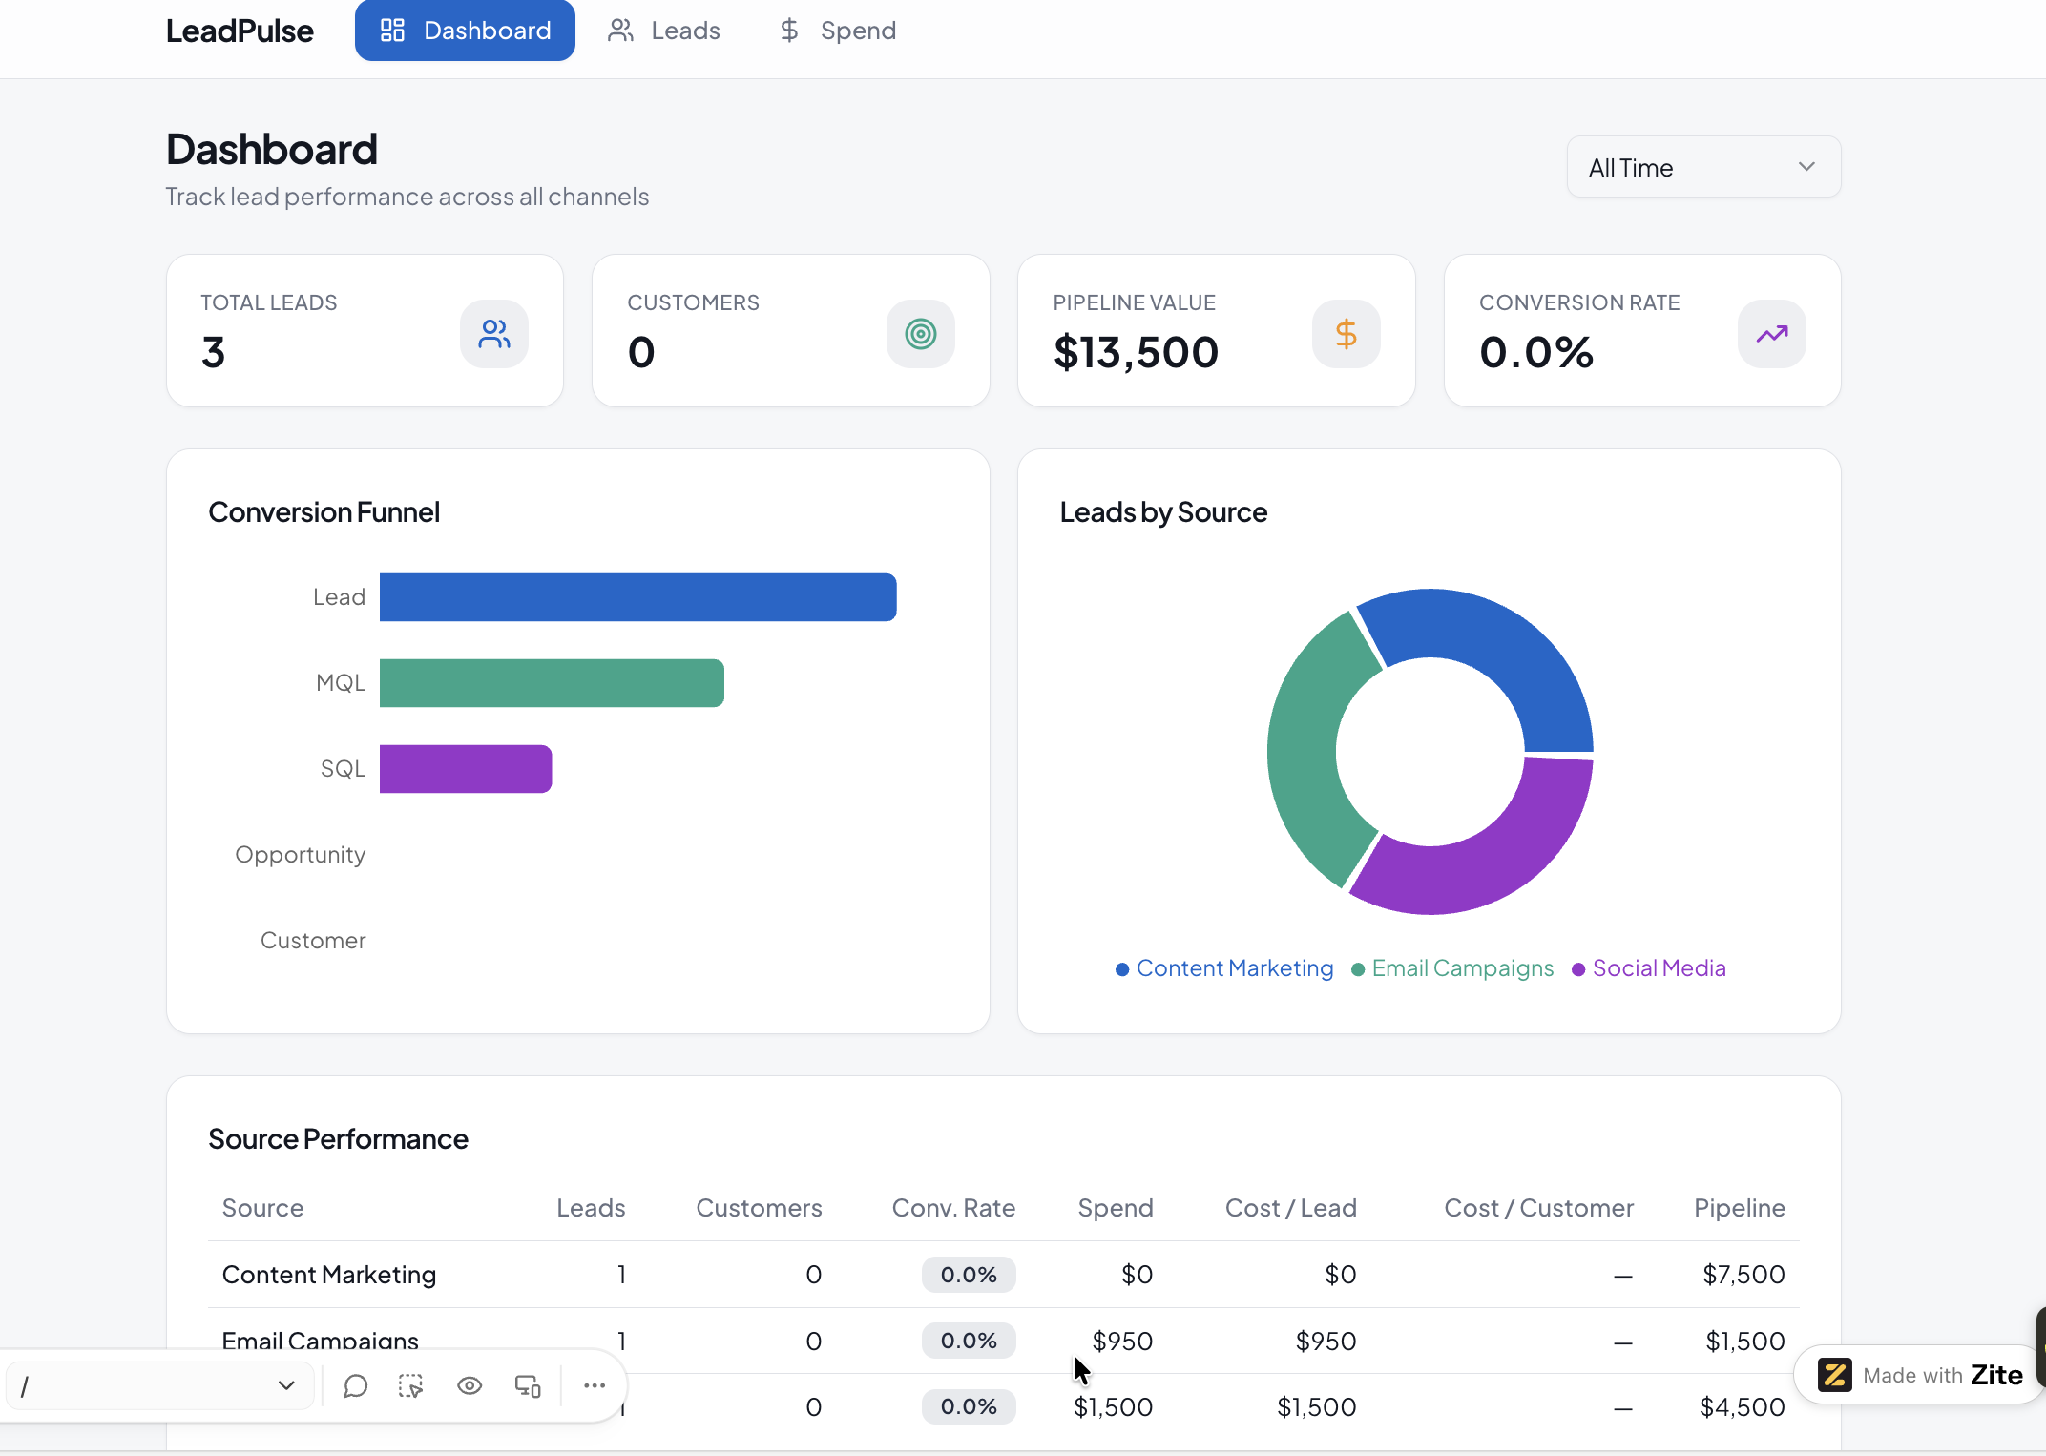
Tracks how leads move from source to closed deal, showing which channels convert instead of just which ones generate volume, useful for marketing and sales leaders deciding where to invest.
Key metrics: Leads by source, conversion rate by stage, cost per acquired customer if marketing spend is tracked.
7. Sales activity dashboard
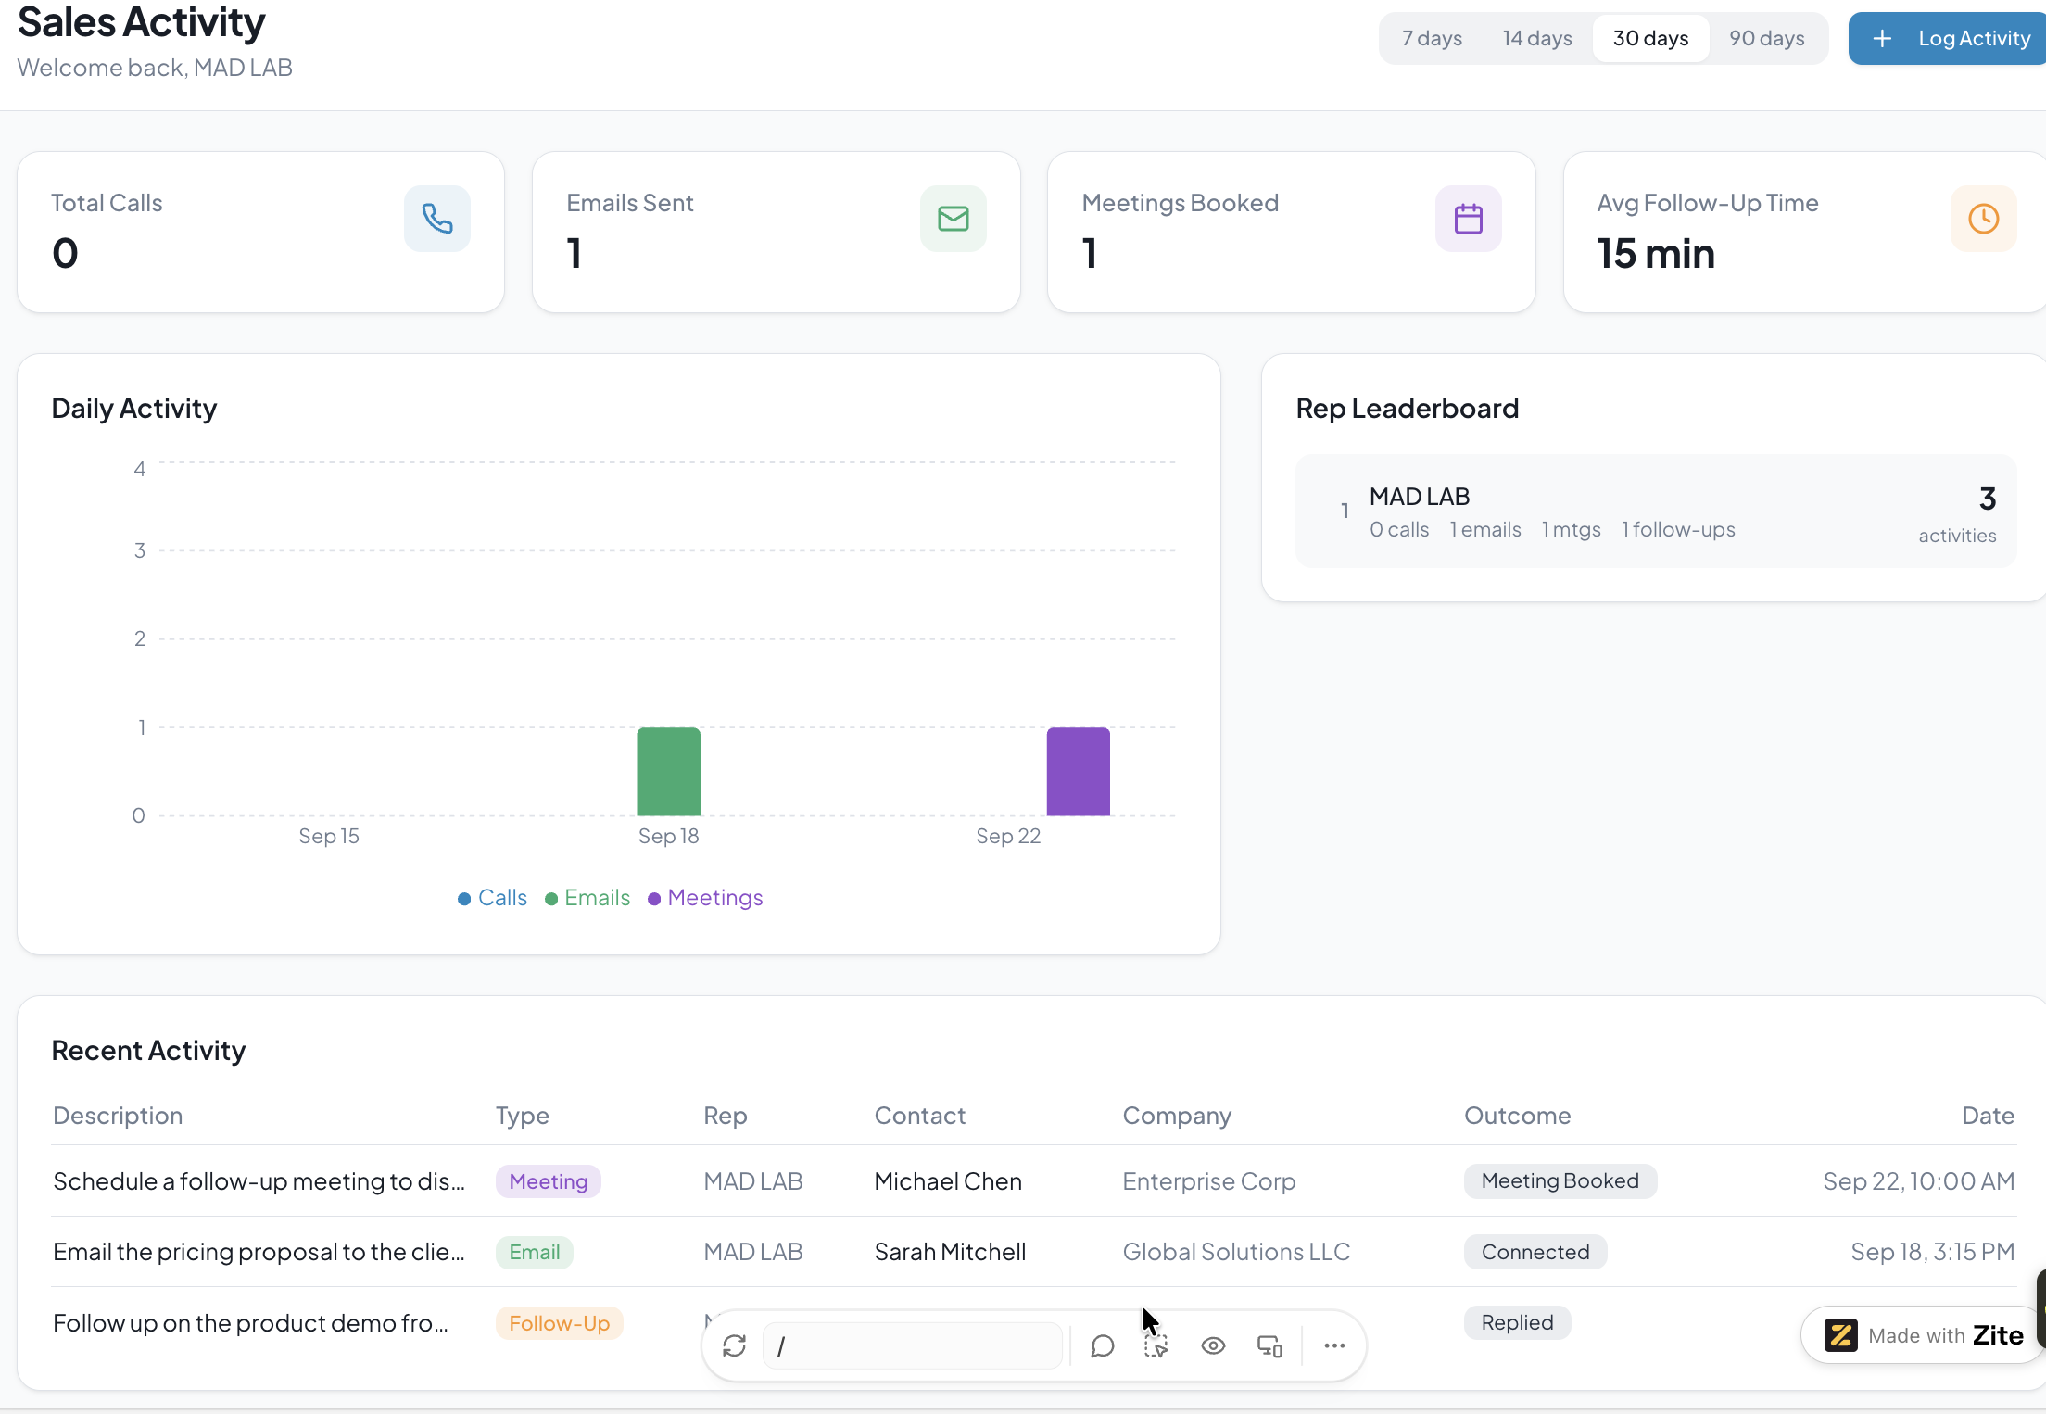
Focuses on leading indicators like calls, emails, and meetings rather than the lagging ones, so an activity slump shows up here before it shows up in the pipeline.
Key metrics: Calls and emails per rep per day, meetings booked, follow-up response time.
8. Renewal and retention dashboard
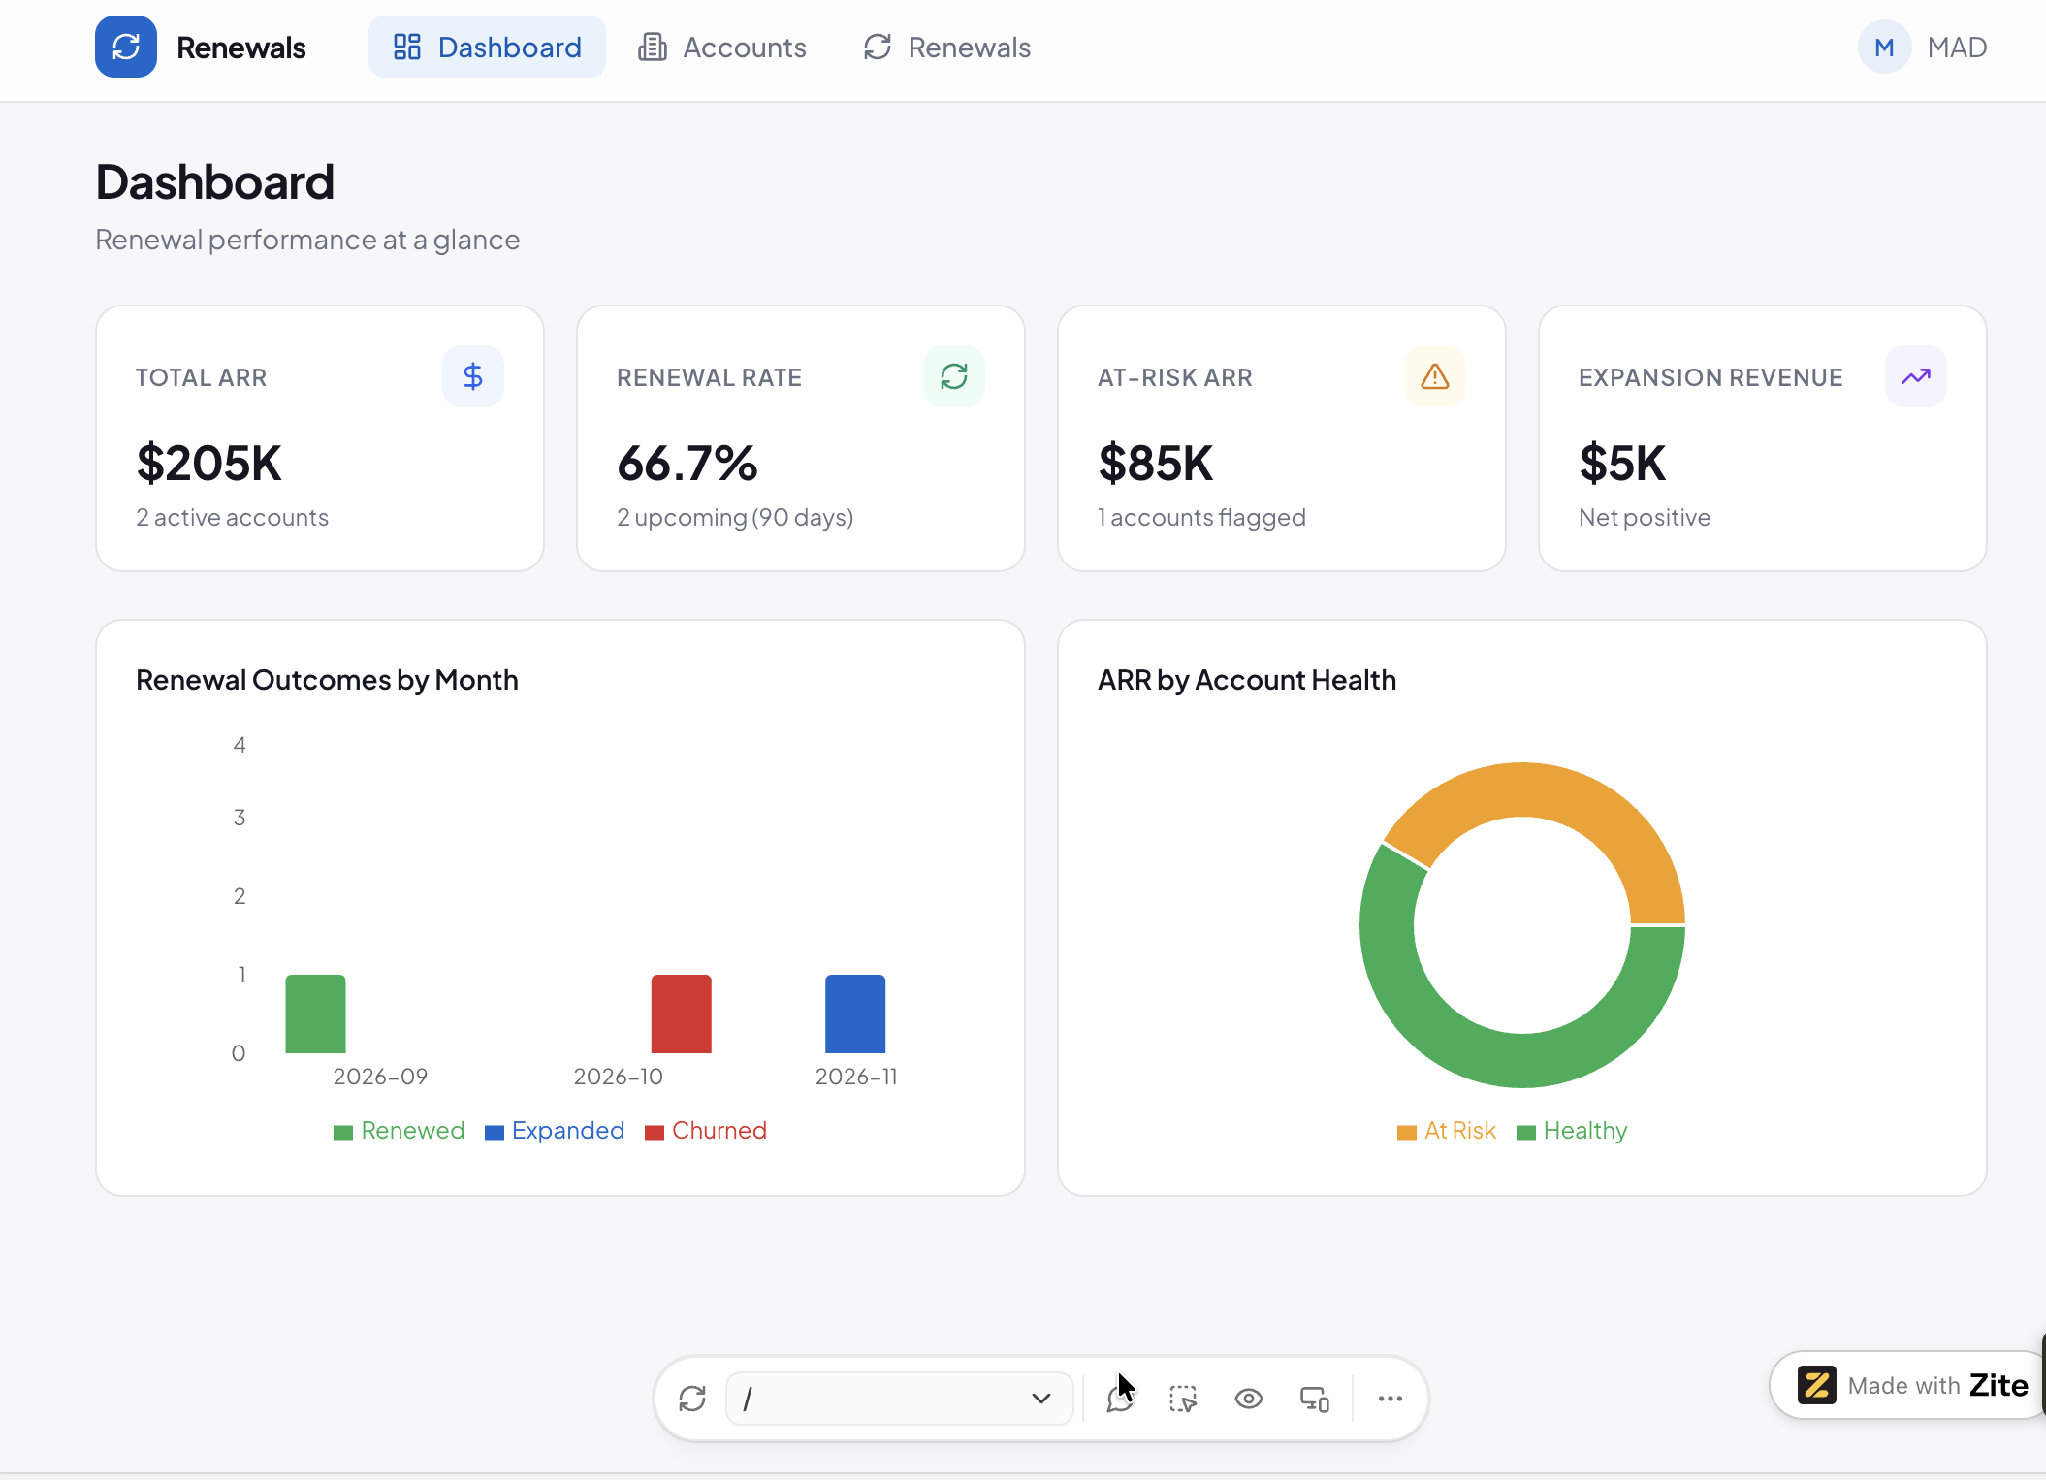
Built for subscription or recurring-revenue businesses, tracking upcoming renewals and accounts at risk instead of new deal flow, useful for account managers and customer success teams protecting revenue.
Key metrics: Upcoming renewals by date, renewal rate, accounts flagged at risk, expansion revenue.
9. Executive sales summary dashboard
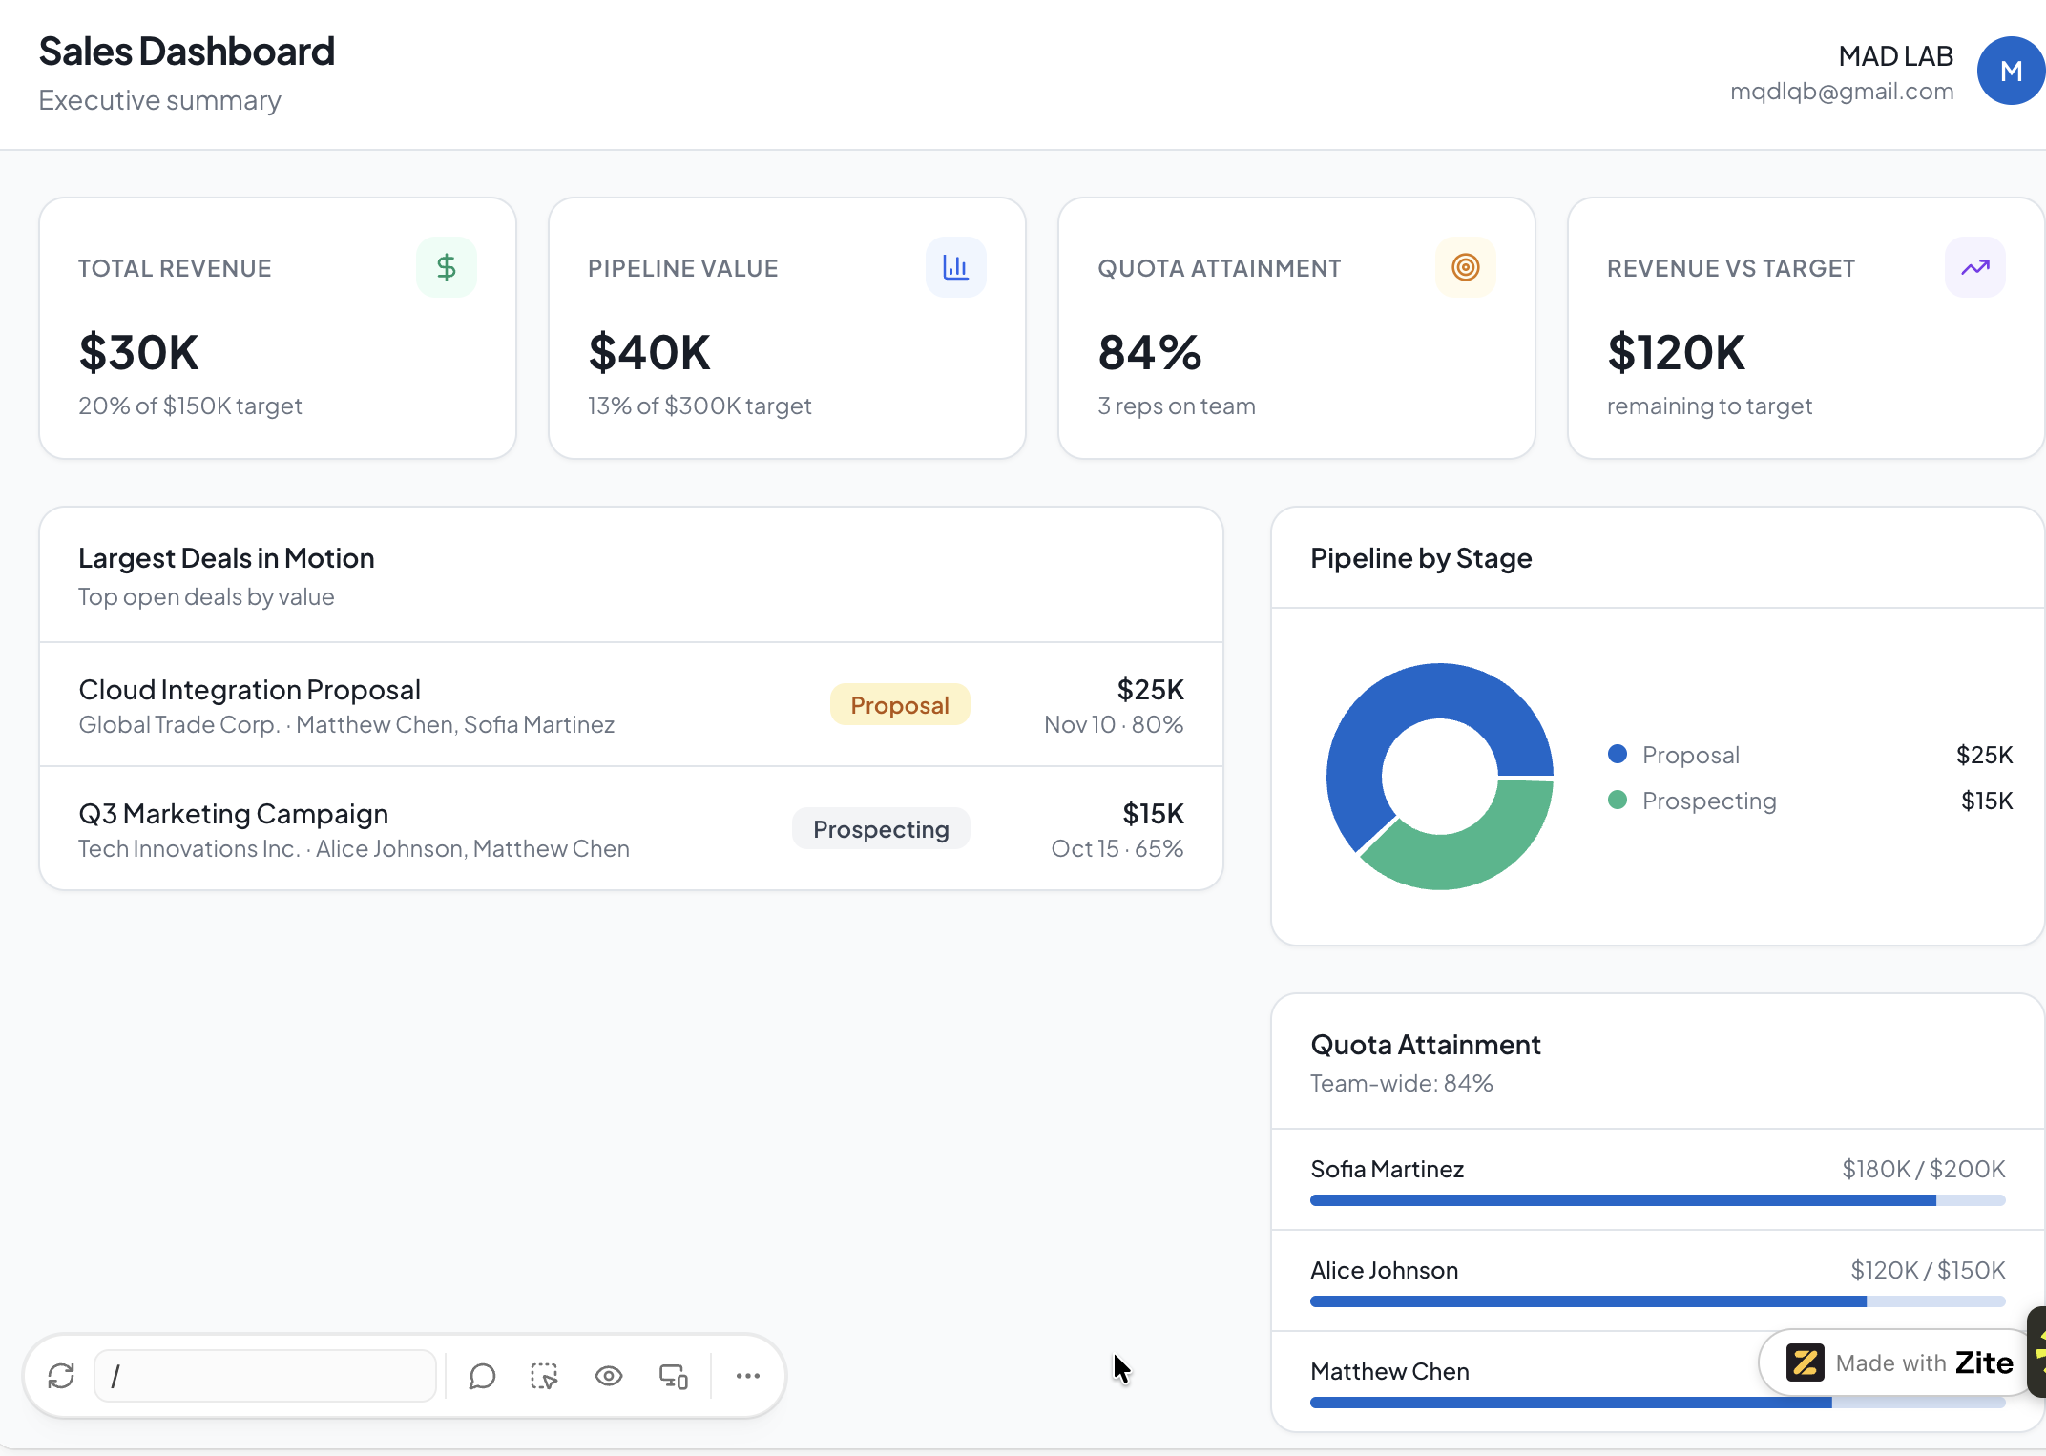
A condensed, high-level view for leadership, showing revenue against target, pipeline health, and team performance in one screen, useful for a board update or a Monday leadership sync without the row-level detail a rep's dashboard needs.
Key metrics: Revenue vs. target, total pipeline value, team-wide quota attainment, top deals in motion.
For the same idea applied to internal operations instead of sales, see 9 operations dashboard templates.
How to build a sales dashboard
Here's the process, whichever tool you use:
- Pick the audience: A rep, a manager, and a leadership team each need a different view. Decide who opens this dashboard daily before you pick a single metric.
- Pick 3-4 metrics, not ten: More numbers on screen doesn't mean more insight. Start with what that audience acts on day-to-day, and add from there only if something's missing.
- Connect the CRM: Pull data live from wherever deals already live, rather than exporting a spreadsheet someone has to refresh by hand.
- Lay out the KPIs: Put the number that matters most somewhere it's seen first. Group related metrics together instead of scattering them by whatever order they were added.
- Add filters: By date range, by rep, by territory, whatever lets the same dashboard answer a narrower question without someone building a second one.
5 tools to build your sales dashboard
These 5 cover the most common cases. For a wider field of options, this roundup of custom dashboard software is worth a look too, and this guide to building a no-code client dashboard covers the same approach for client-facing work.
Here's where each tool fits:
- Tableau: Deep analytics and visualization for teams with a dedicated analyst to build and run dashboards. Paid editions start at $15/user/month for Standard, with Enterprise at $35/user/month, billed annually. Those are view-only seats. Every deployment needs at least one Creator license to build anything, and that is $75/user/month on Standard, $115 on Enterprise.
- Geckoboard: A simpler dashboard tool built for showing a handful of live metrics on a screen, popular for team-visible pipeline and activity views. There's no free plan, just a 14-day trial. Plans start from $99/month for Essentials, with Performance from $399/month and Enterprise custom-priced.
- Databox: Combines scheduled report snapshots with live dashboards, pulling from a CRM alongside other sales and marketing tools. Free for one user, a single dashboard, and 3 data sources. Paid plans start at $89/month for Analyst, with Team at $249/month.
- HubSpot: If your CRM is already HubSpot, Sales Hub's native reporting builds dashboards without a separate tool. Paid plans start at $20/seat/month for Starter. Professional is $100/seat/month plus a $1,500 onboarding fee, where forecasting starts, and Enterprise is $150/seat/month plus a $3,500 fee.
- Google Data Studio (formerly Looker Studio): Free to use, and strong for a team already living in Google Sheets or connected to Google Analytics. Setup takes longer than a purpose-built dashboard tool, and non-Google data sources often need a paid connector.
Build your sales dashboard with Zite
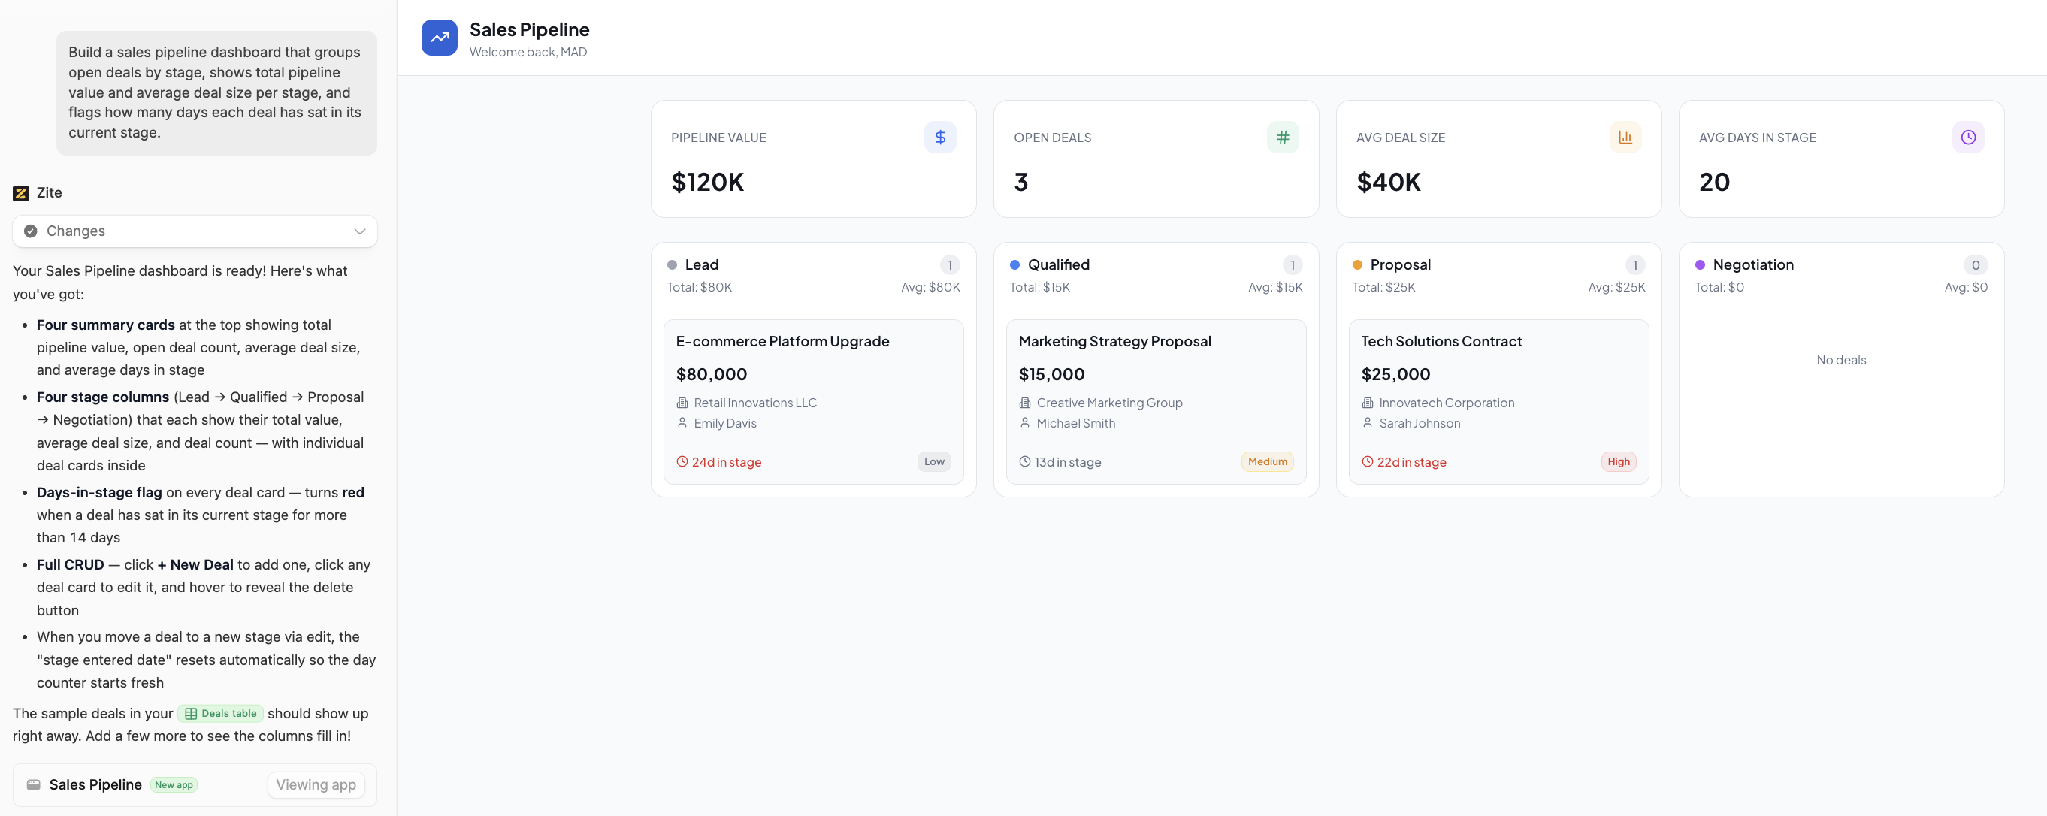
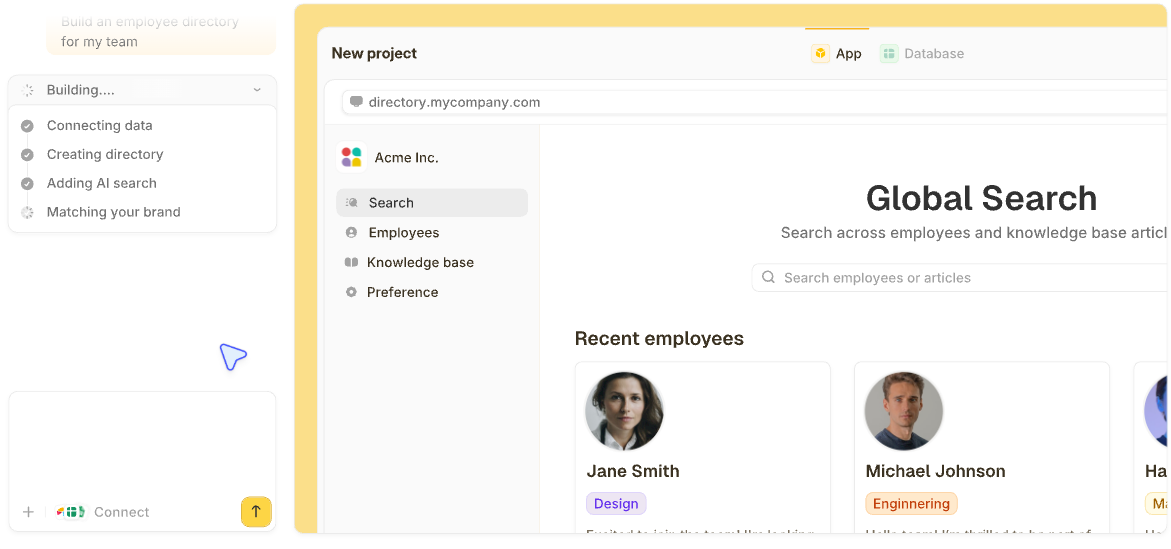
Every dashboard above started the same way: you tell Zite the metrics you want, who will use the dashboard, and where the data lives, and it builds the dashboard and the records behind it. If your deals already sit in a CRM like HubSpot or in a Google Sheet, connect it, and the dashboard reads from that data.
If they're scattered across a CRM, a spreadsheet, and a few Slack channels, Zite can become the one place they live, with the dashboard on top.
See this walkthrough on how to generate a dashboard in seconds using AI.
Here's how Zite helps:
- Generate the dashboard from a prompt: Describe your sales dashboard, and Zite builds the tables, charts, and views in minutes.
- Built-in database: Tables and fields live inside Zite, so there's no separate database to wire up or pay for.
- Visual app logic you can inspect: Every workflow Zite generates appears as a flowchart, so you can trace exactly how an alert or status update fires.
- Connect existing data: Native integrations with Airtable, Google Sheets, and more pull data wherever it currently lives.
- Each person sees their own view: A rep opens the dashboard to their own pipeline and leadership gets revenue against target, all built on the same records and available on every plan.
- Unlimited users on every plan: No per-seat pricing, so adding the whole sales team doesn't raise the bill.
Zite is free with unlimited users and 50 AI credits a month, capped at 10 messages a day. Paid plans start at $25/month for Pro, with 100 credits and a custom domain. Business is $89/month with 400 credits. Team is $300/month with 800 credits, and Enterprise is custom-priced.
Start building with Zite for free and generate your first sales dashboard today.
Frequently asked questions
What is a sales dashboard template?
A sales dashboard template is a pre-built layout showing key sales metrics, like pipeline value, quota attainment, or win rate, with charts and filters already configured. You customize it with your own data instead of building the layout from scratch.
What KPIs should a sales dashboard include?
The KPIs a sales dashboard should include depend on who's using it, but the ones that recur across most of the examples above are quota attainment, total pipeline value, and win rate. A rep-level dashboard adds activity metrics like calls and emails, while a leadership dashboard adds revenue against target.
What's the best free tool for a sales dashboard?
Google Data Studio (formerly Looker Studio) is the strongest free sales dashboard option if your data lives in Google Sheets or connects to Google Analytics, though setup takes longer than a purpose-built dashboard tool. Zite is also free to start, and it builds the dashboard you describe in minutes, with unlimited users on the free plan.
How do I customize a sales dashboard template to fit my workflow?
You customize a sales dashboard template by swapping the connected data source and adjusting which fields display, though bigger changes, like adding a metric the template didn't anticipate, often hit a wall. Zite has no fixed layout, so a missing metric is one more description, and Zite adds the field, the calculation, and the chart.
Can I build a sales dashboard without code?
Yes, you can build a sales dashboard without code using any tool in this guide, including Zite.