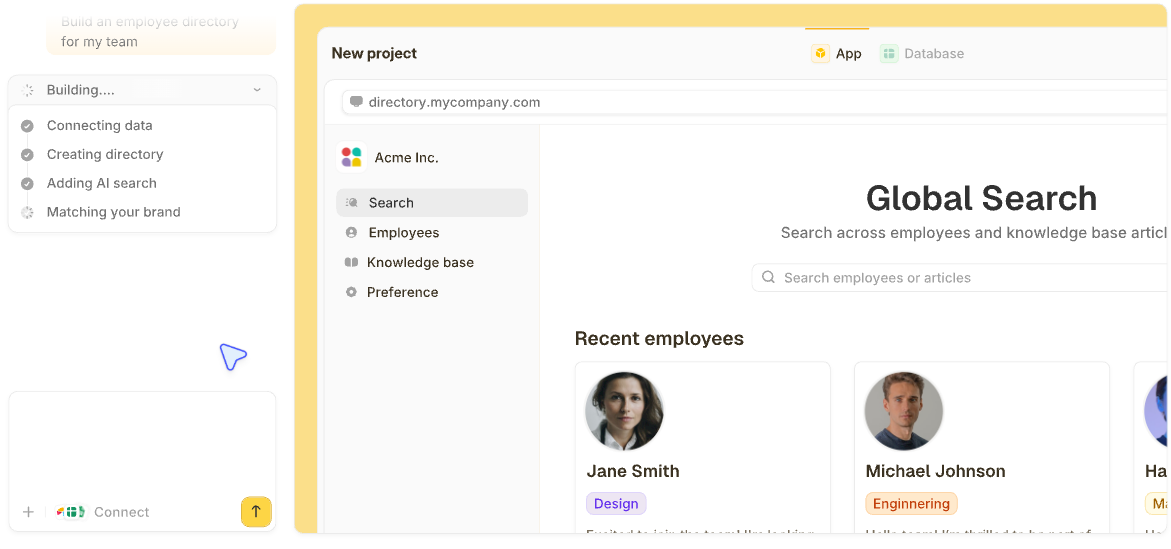

A financial reporting dashboard shows revenue, margin, cash, and budget variance on one screen, updated from your accounting data. If you pull QuickBooks exports every month-end, one live view can replace that routine.
Below are nine examples by report type and six steps to build your own.
What is a financial reporting dashboard?
A financial reporting dashboard is a visual summary of a company's key financial numbers. It's built from accounting data and updates as the books change.
A dashboard lets a reader change the date range or open the details behind a number, with no new export to request.
The best dashboards answer a single question, such as whether this month is on budget or which invoices need a phone call this week.
9 financial reporting dashboard examples by report type
These nine examples cover the reports finance teams build most, from the executive summary to lists of invoices and bills. Each one lists its audience, the decision it drives, and the metrics on screen.
Every example below was built in Zite with sample data for Harbor Studio, a fictional design studio.
1. Executive summary dashboard
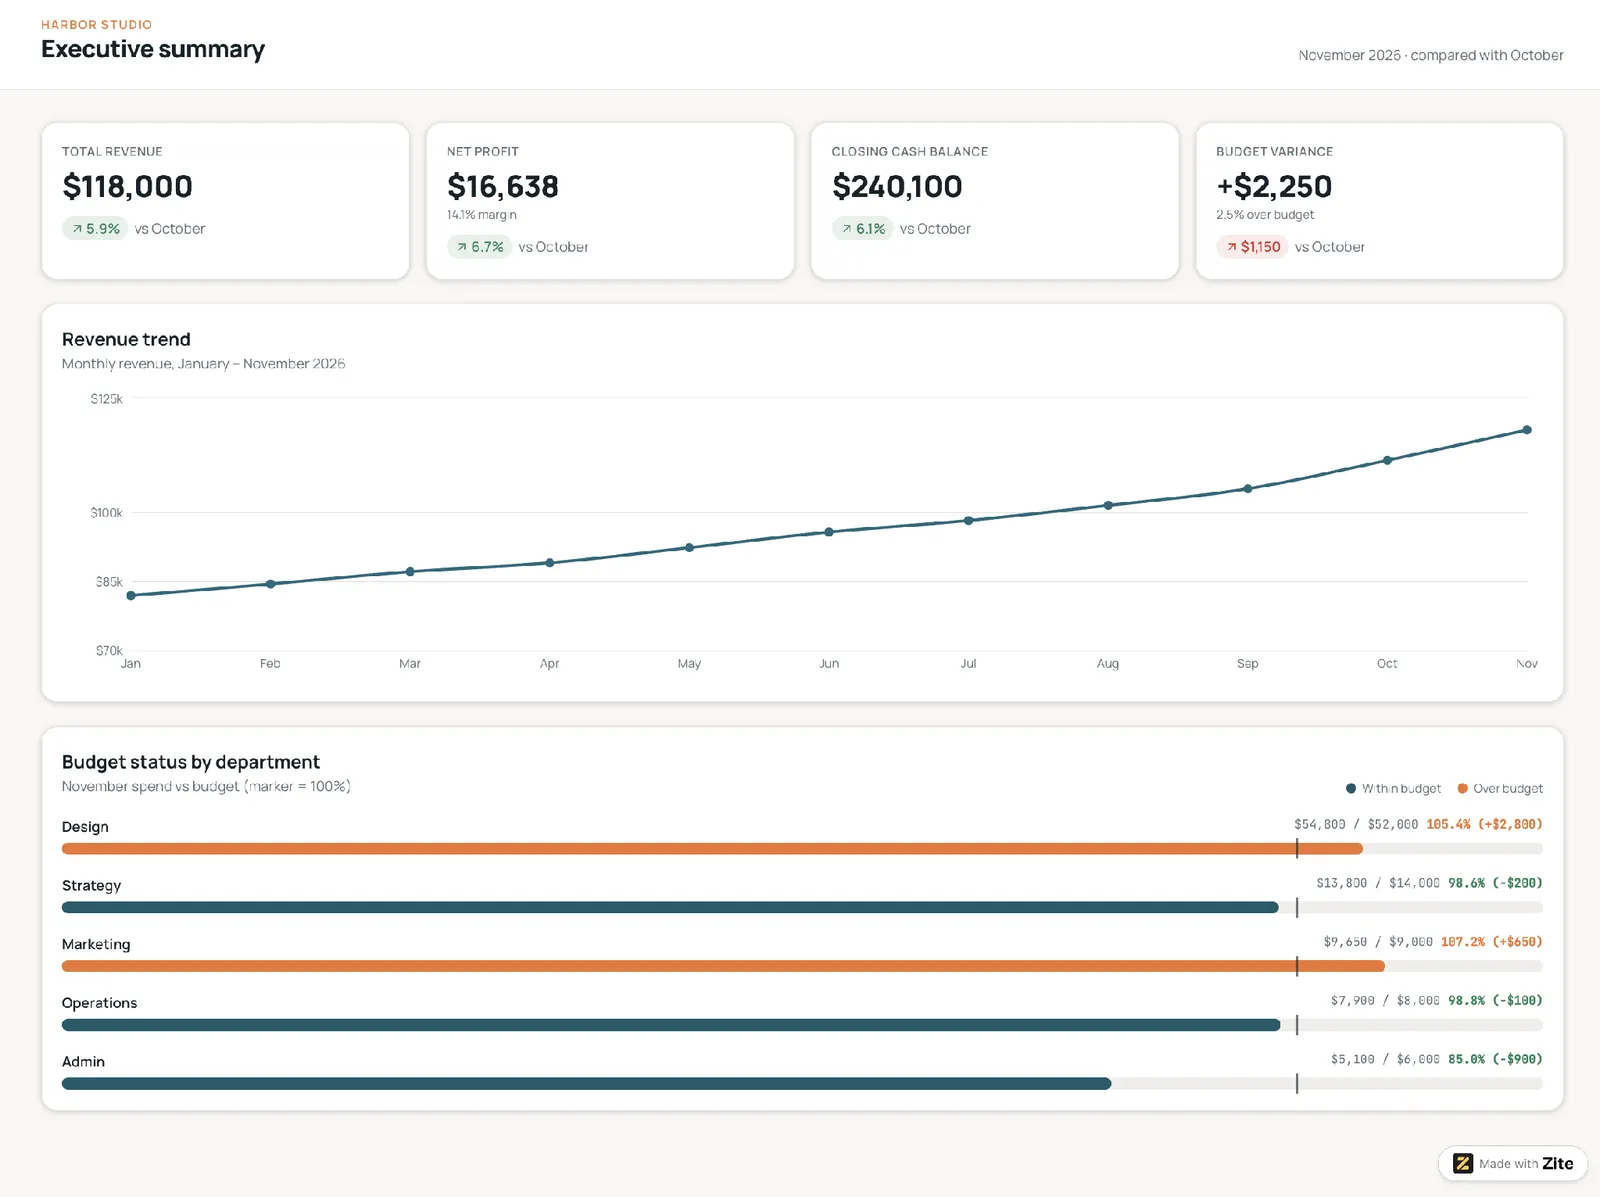
This is the one-screen view for a monthly review. The headline numbers go on top, with one trend chart underneath. Any number that needs explaining links to a detailed report.
Who it's for: Owners, CEOs, and CFOs preparing for a monthly or board review.
Decision it drives: Whether the business is on track and which report to open next.
Metrics shown: Total revenue, net profit, closing cash balance, and budget variance.
Template prompt: "Build an executive summary dashboard from our ledger and budget records. Show total revenue, net profit, closing cash balance, and budget variance as headline tiles compared with last month, a monthly revenue trend line below them, and each department's spend against its budget. Let any headline number open its detailed report."
2. Profit and loss dashboard
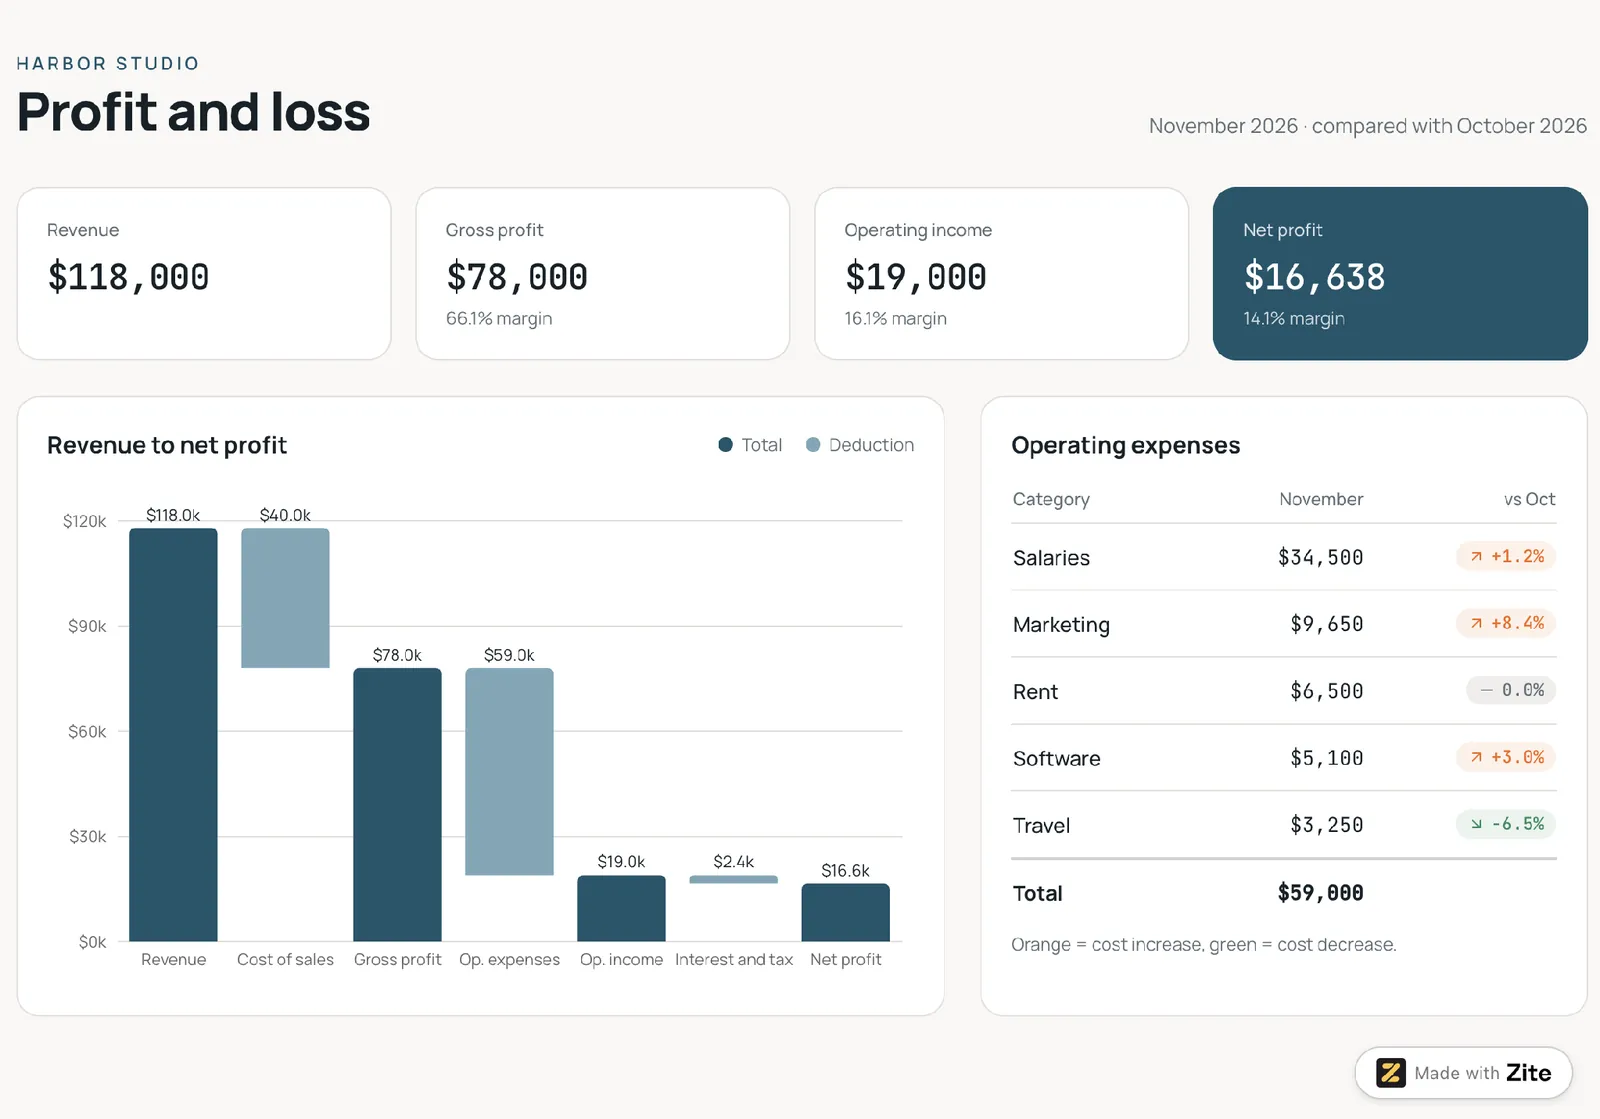
This dashboard lays out the monthly profit and loss statement as a waterfall from revenue down to net profit. A table of expense categories beside it shows the change from the prior period. Those categories come from how you track business expenses day to day.
Who it's for: Controllers and finance managers closing the month.
Decision it drives: Which costs are cutting into margin and need action.
Metrics shown: Total revenue down to net profit, with gross margin and operating income in between.
Template prompt: "Build a profit and loss dashboard from our ledger records. Show revenue, gross profit, operating income, and net profit as tiles with their margins, a waterfall from revenue down to net profit, and a table of expense categories beside it with the change from the prior month, colored orange for increases and green for decreases."
3. Cash flow dashboard
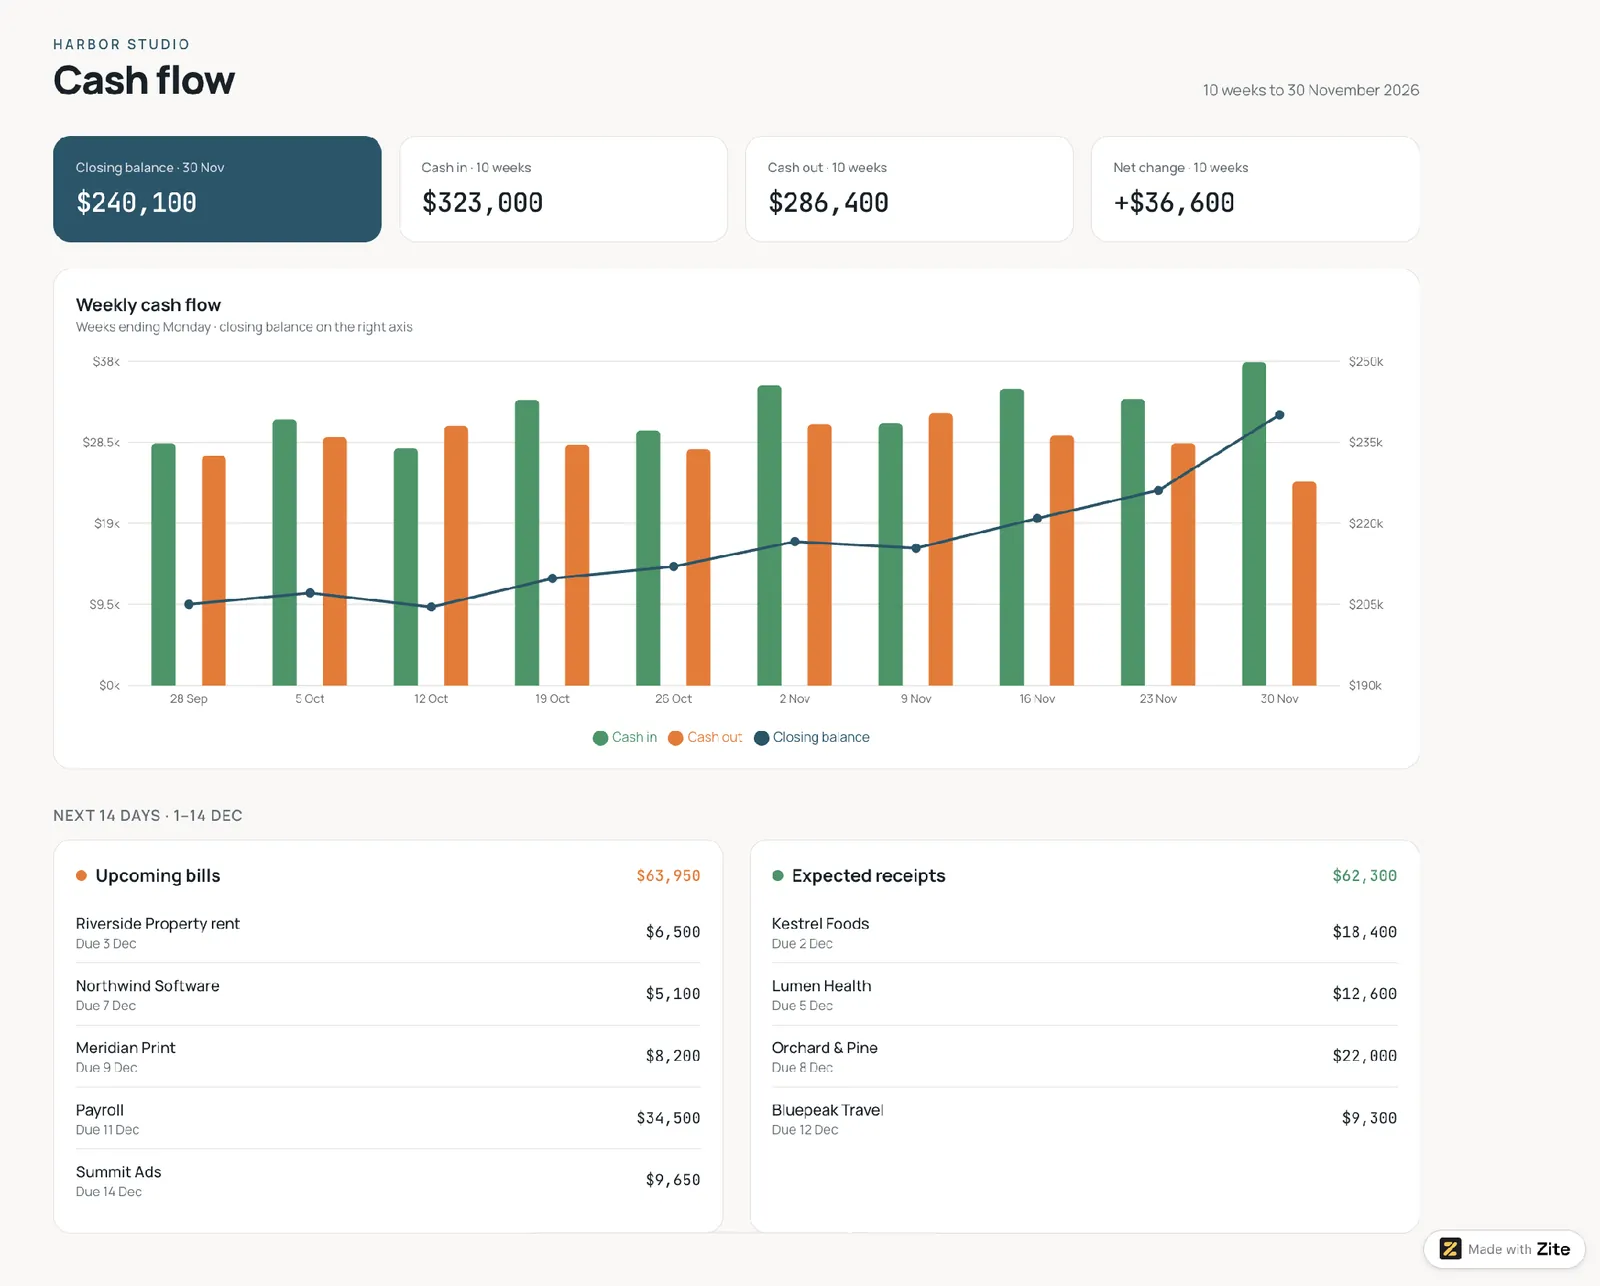
Each week shows cash in and cash out as a pair of columns, with the closing balance drawn as a line across them. Below the chart, a short list shows upcoming bills and expected receipts.
Who it's for: Owners and finance leads watching how long the cash will last.
Decision it drives: Whether to delay a purchase, chase invoices, or arrange financing.
Metrics shown: Cash in, cash out, and closing balance.
Template prompt: “Build a cash flow dashboard from our ledger records. Show cash in and cash out as weekly columns with the closing balance as a line across them, and a short list of upcoming bills and expected receipts below the chart.”
4. Budget variance dashboard
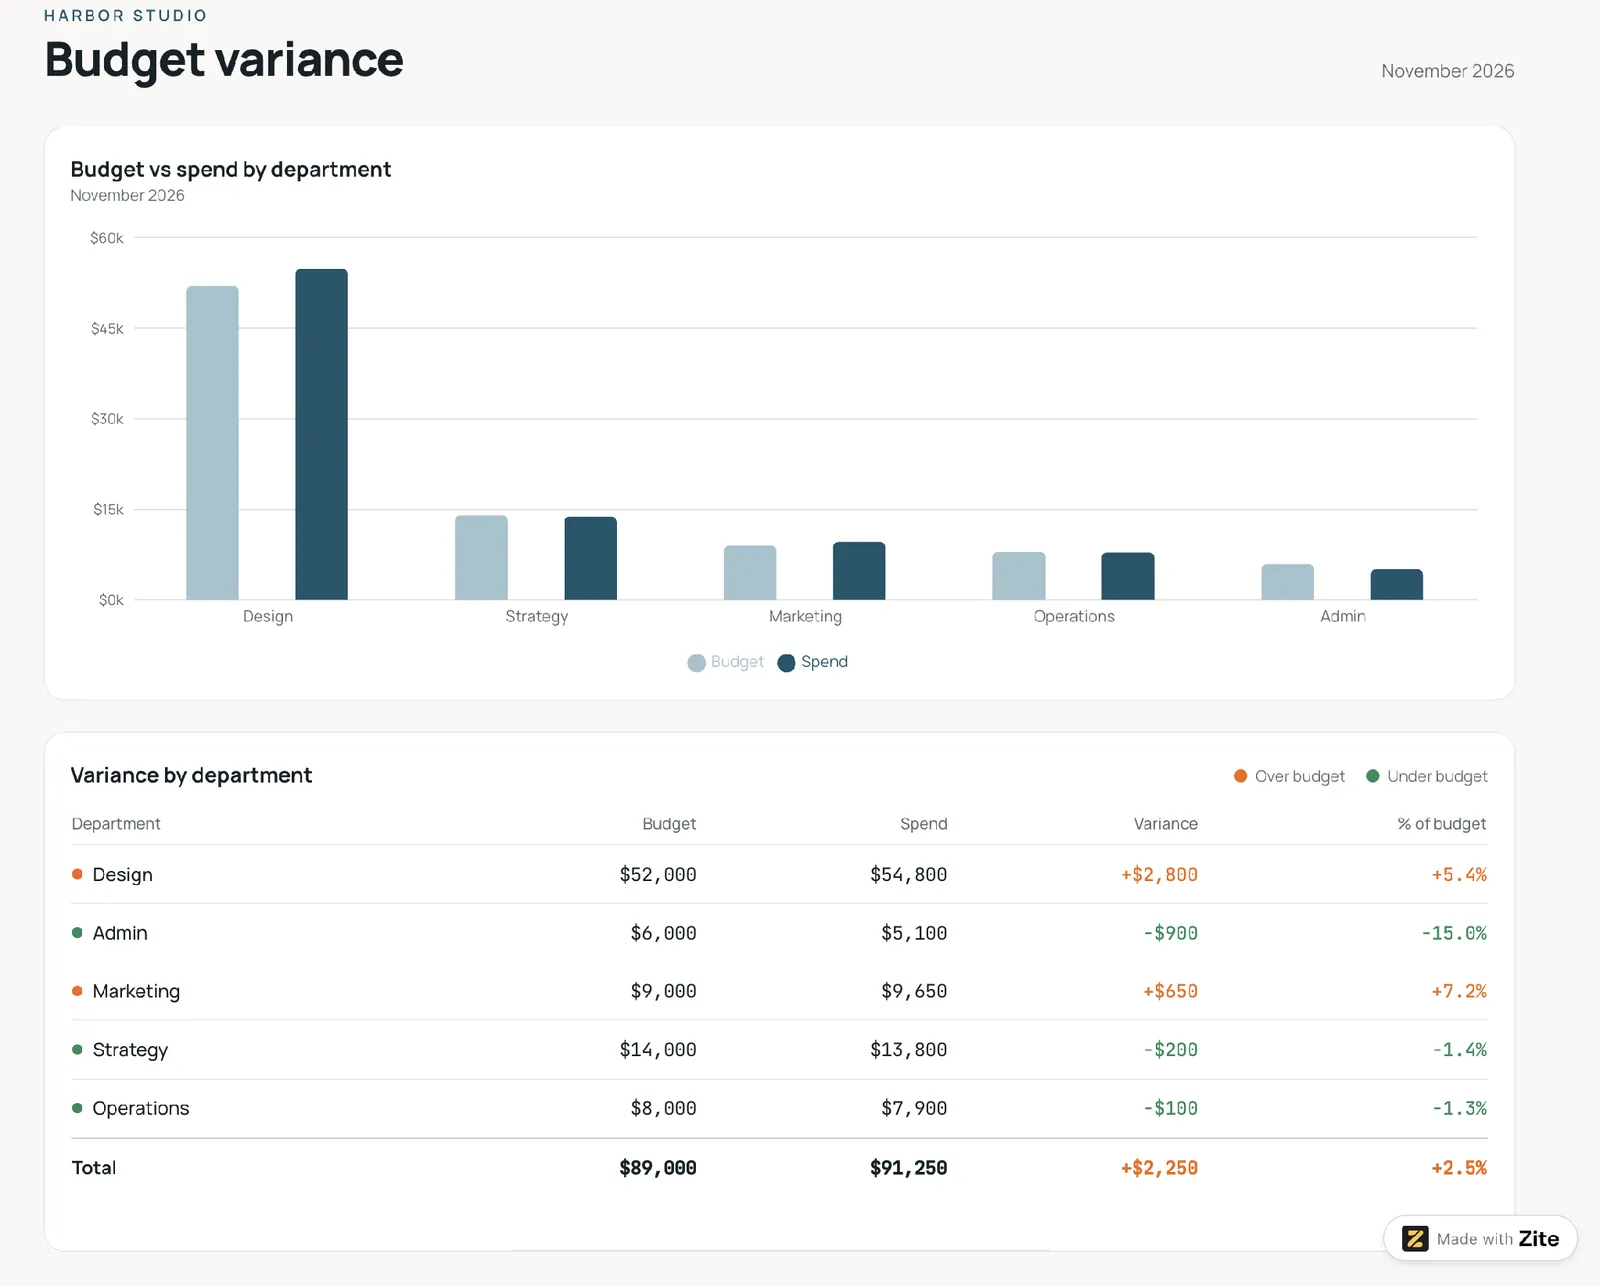
Each department's spend appears next to its budget. A table below ranks departments by the size of the gap. The dashboard colors adverse variances, where spending runs over budget, differently from positive ones, so problem areas stand out. A forecast column can also show where each department is likely to finish the year.
Who it's for: Department heads and finance planning teams.
Decision it drives: Which budgets to tighten and which to top up.
Metrics shown: Budget variance in dollars and as a percentage.
Template prompt: “Build a budget variance dashboard from our ledger and budget records. Show each department’s spend next to its budget, budget variance in dollars and as a percentage, and a table that ranks departments by the size of the gap. Color adverse variances differently from positive ones.”
5. Accounts receivable aging dashboard
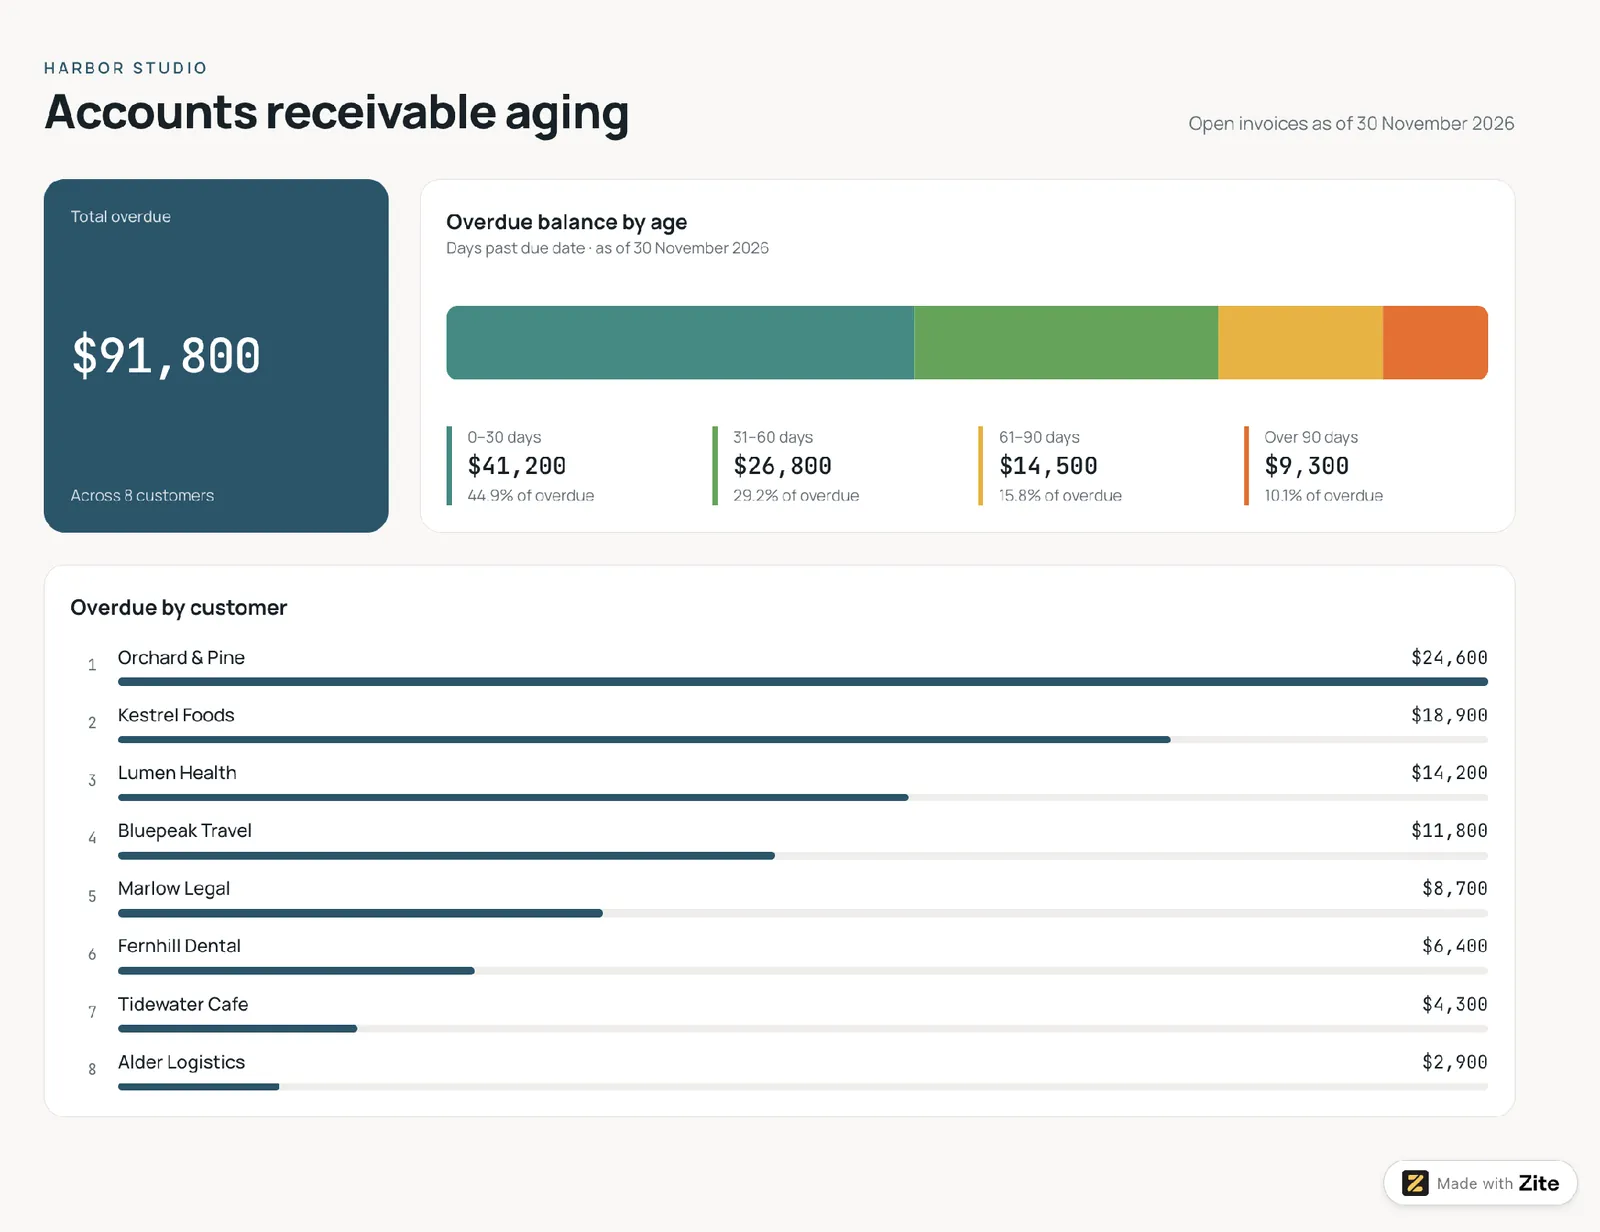
Open customer invoices are grouped by how long they've gone unpaid, as in an accounts receivable aging report. Common buckets are 0 to 30 days, 31 to 60, 61 to 90, and over 90.
The dashboard ranks the customers with the largest overdue balances below the chart.
Who it's for: Credit controllers and bookkeepers.
Decision it drives: Which customers to call first, and whether to tighten payment terms.
Metrics shown: Overdue balance by age bucket and top overdue customers.
Template prompt: “Build an accounts receivable aging dashboard from our open customer invoices. Group overdue balances into 0 to 30, 31 to 60, 61 to 90, and over 90 days, and rank the customers with the largest overdue balances below the chart.”
6. Accounts payable aging dashboard
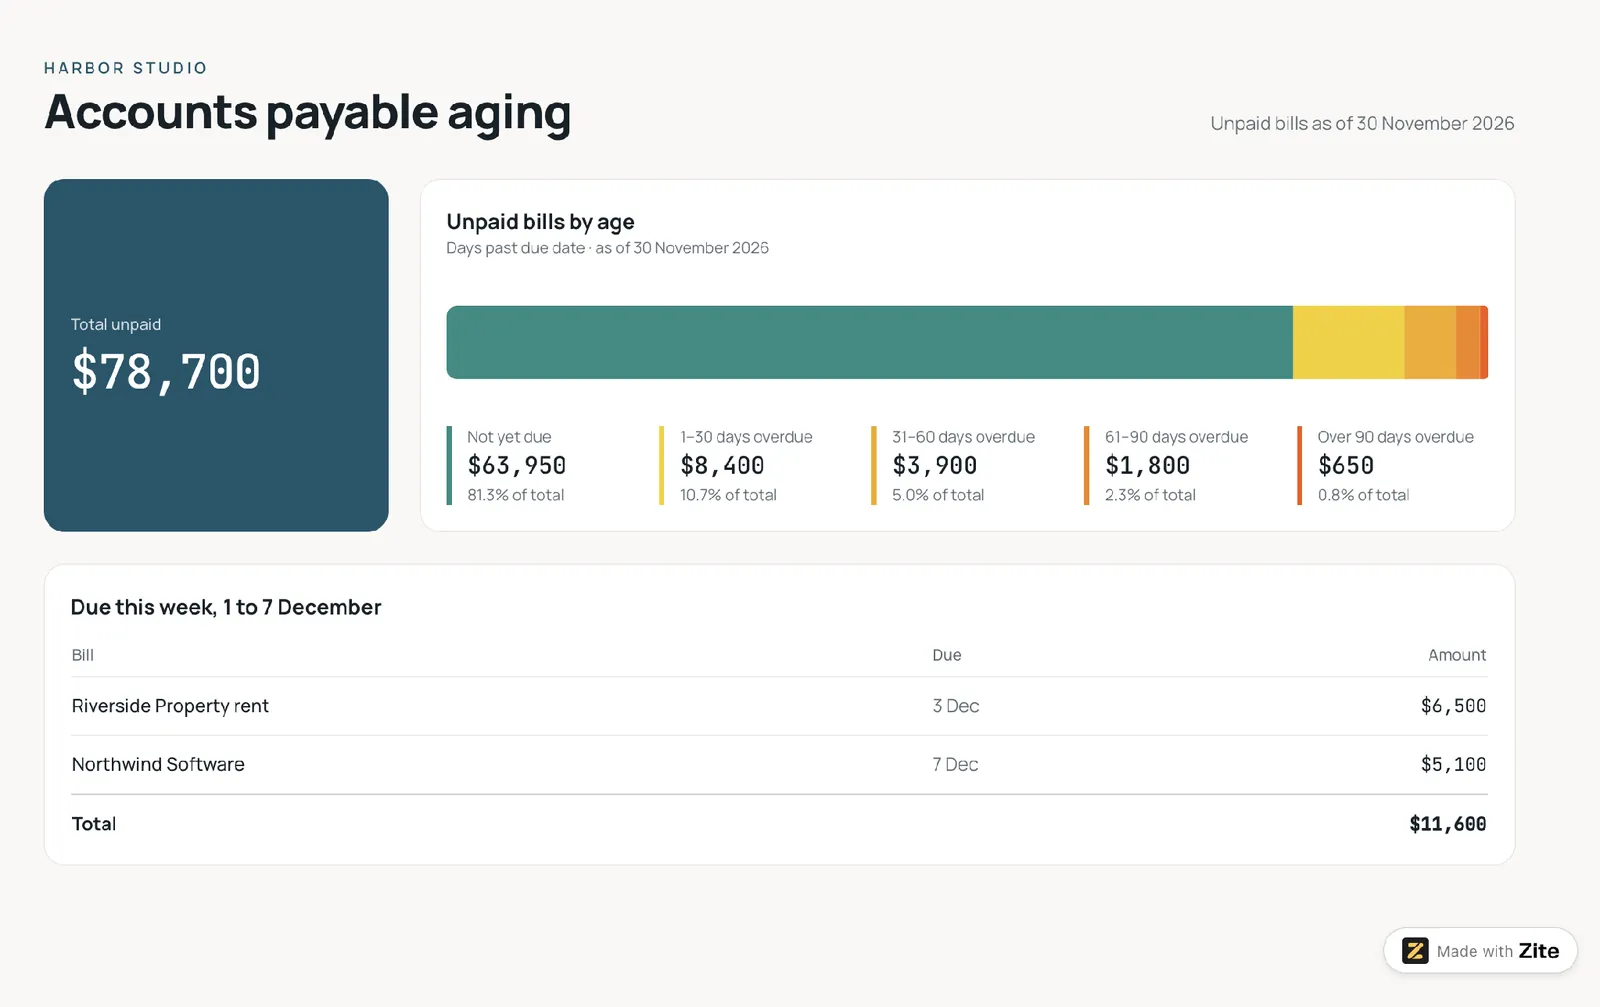
Unpaid bills are grouped by how far past due they are, with a separate bucket for bills not yet due. A list shows which bills fall due this week, so you can plan payments before they come due.
Who it's for: Accounts payable clerks and operations managers.
Decision it drives: Which bills to pay now to protect cash and vendor relationships.
Metrics shown: Unpaid bills by age bucket, amount due this week, and cash out.
Template prompt: "Build an accounts payable aging dashboard from our unpaid vendor bills. Show the total unpaid, group the bills into not yet due, 1 to 30, 31 to 60, 61 to 90, and over 90 days overdue, and list the bills due this week with their total."
7. Balance sheet and ratio dashboard
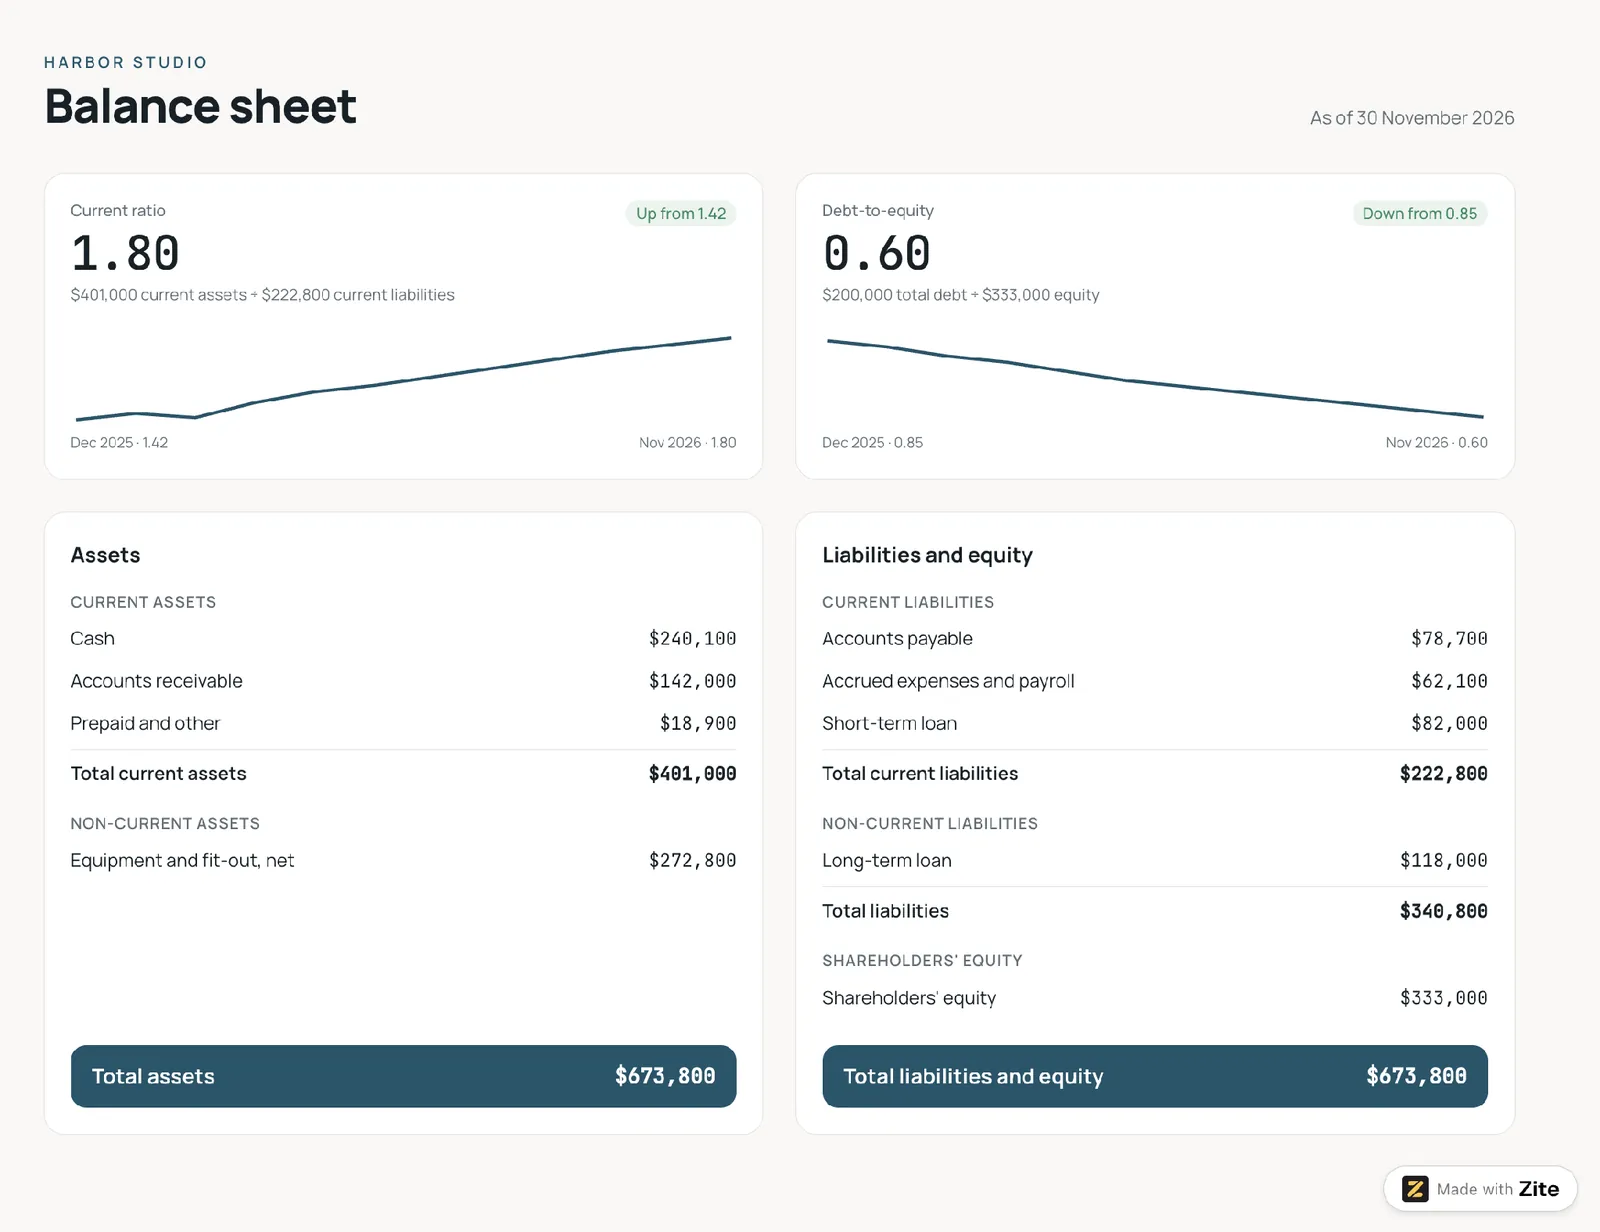
Each ratio appears as one number with a trend line. One compares current assets with current liabilities, and the other compares total debt with equity. A condensed balance sheet below gives the details.
Who it's for: Owners and CFOs getting ready to talk to a lender.
Decision it drives: Whether short-term bills are covered and how much debt the business carries.
Metrics shown: Current ratio and debt-to-equity.
Template prompt: "Build a balance sheet and ratio dashboard from our ledger records. Show the current ratio (current assets divided by current liabilities) and debt-to-equity (total debt divided by shareholders' equity) as single numbers with a 12-month trend line each, and a condensed balance sheet below them."
8. Revenue and gross margin dashboard
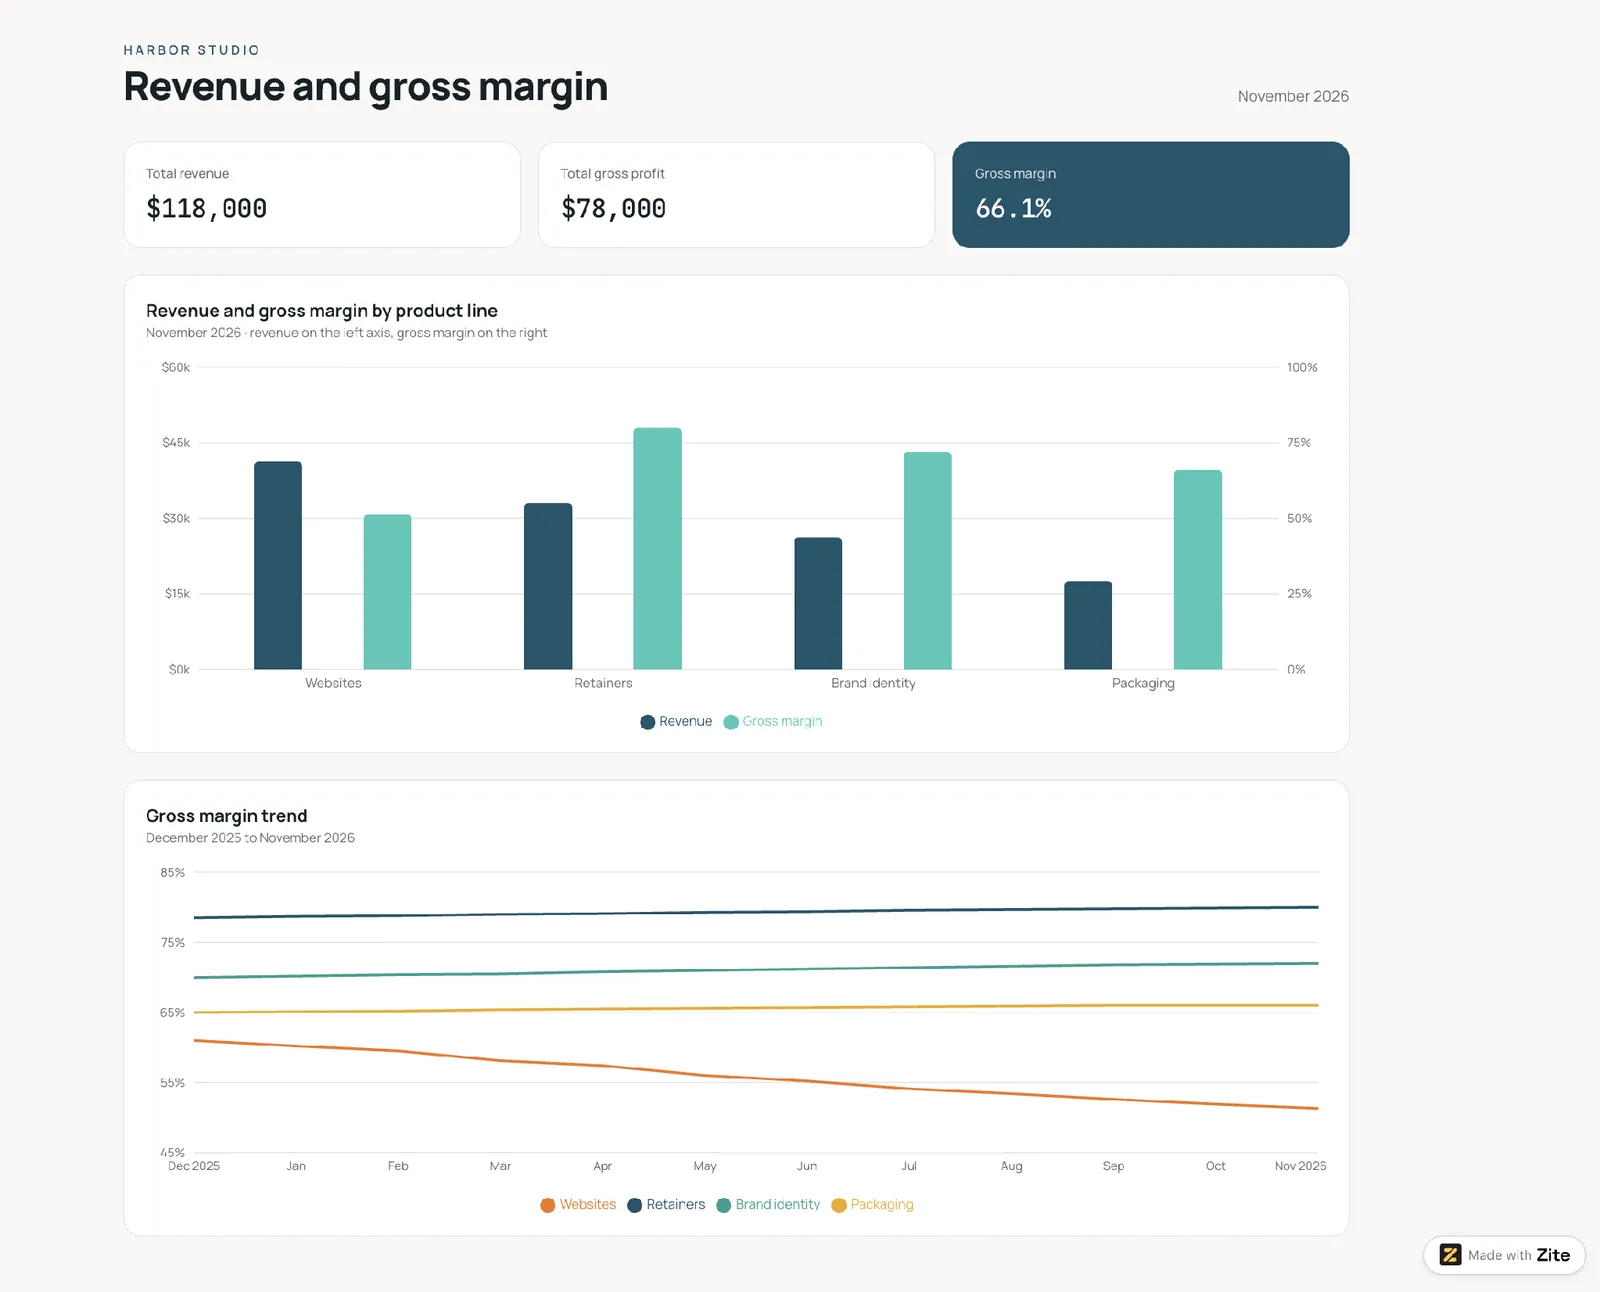
Revenue and gross margin appear side by side for each product line, customer segment, or sales channel. A 12-month trend shows whether a high-revenue line is losing margin without anyone noticing.
Who it's for: Sales leaders and owners setting prices.
Decision it drives: Where to focus sales effort and which prices to revisit.
Metrics shown: Total revenue and gross margin by segment.
Template prompt: "Build a revenue and gross margin dashboard from our ledger records. Show total revenue, gross profit, and gross margin as tiles, revenue and gross margin side by side for each product line, customer segment, or sales channel, and a 12-month gross margin trend for each one, so a high-revenue line that is losing margin stands out."
9. Project and department ROI dashboard
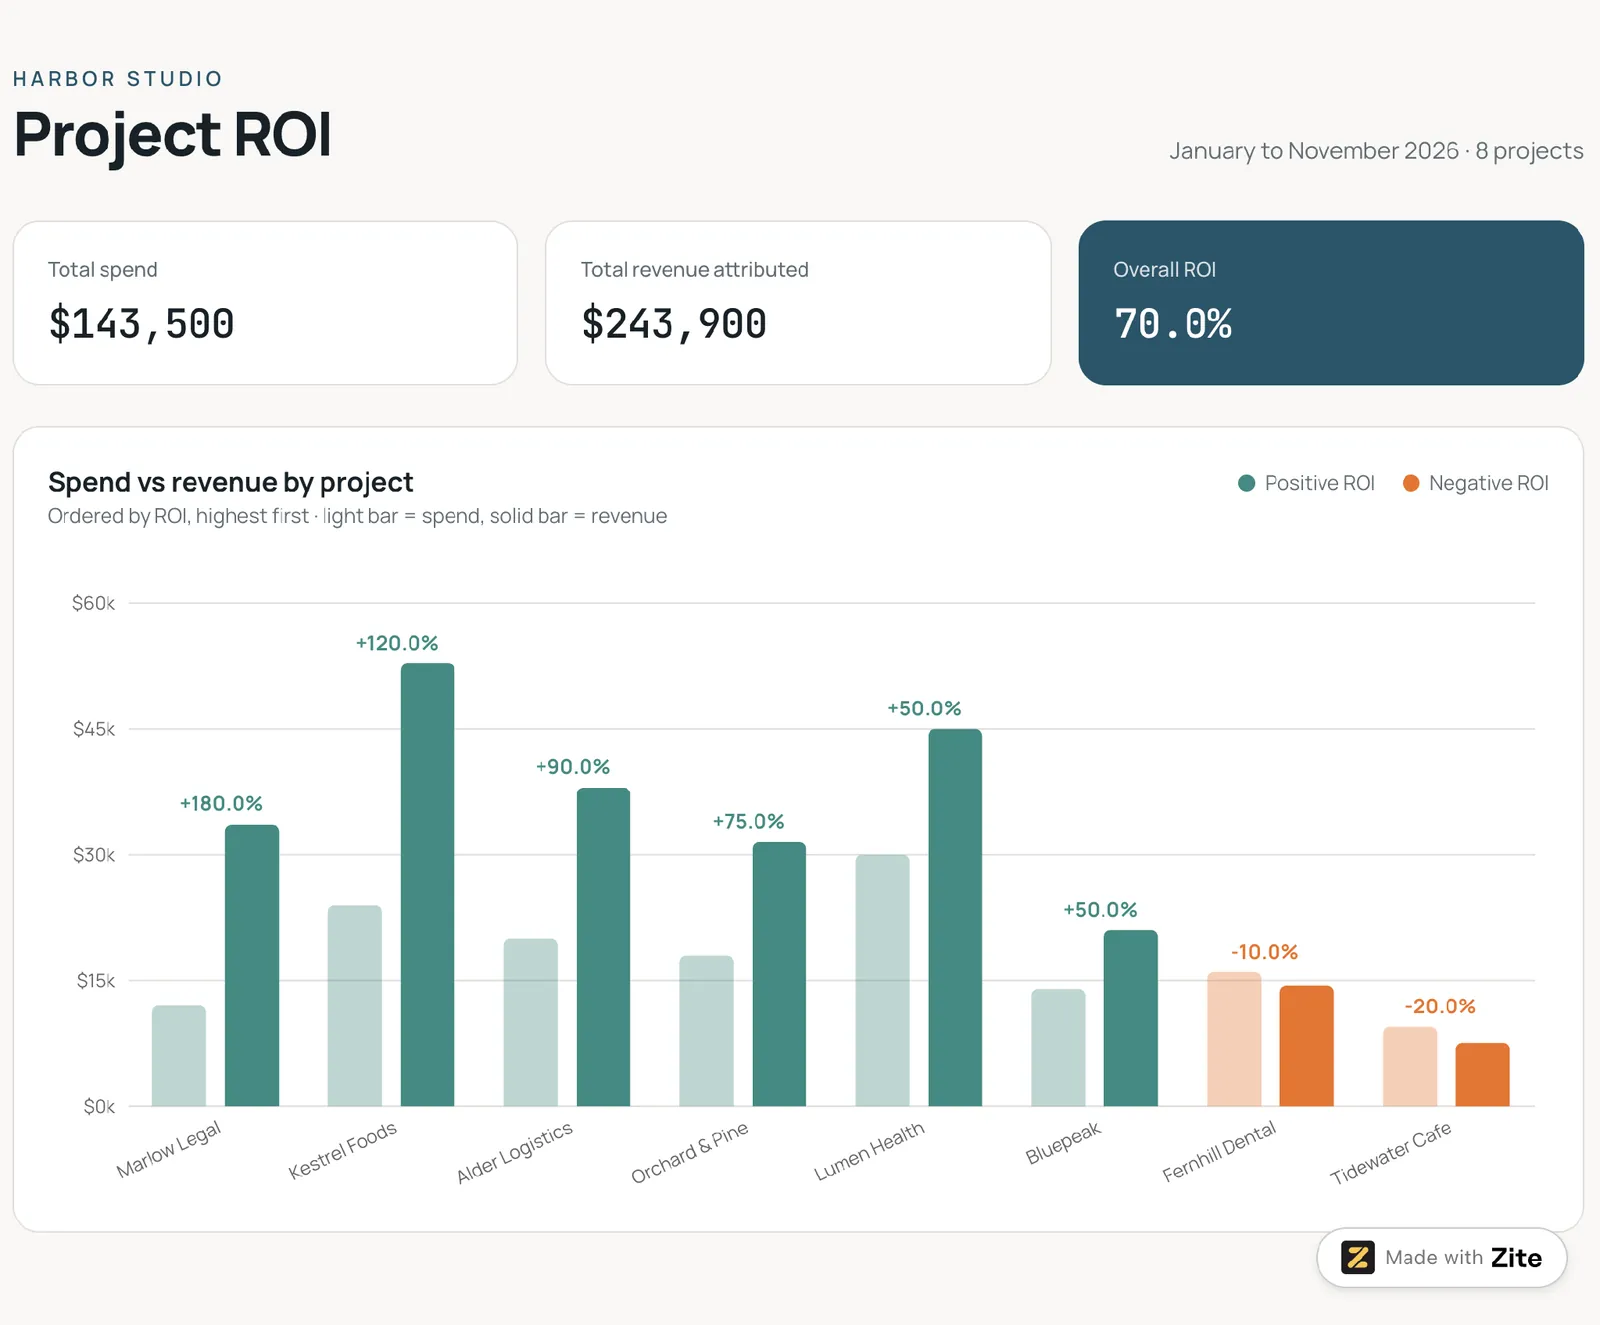
Spend and return for each project or department appear on one chart. Projects that earn back their cost stand out. To track non-financial work, pair it with an operations dashboard template.
Who it's for: Operations leaders and founders judging investments.
Decision it drives: Which projects to continue, expand, or stop.
Metrics shown: ROI, spend, and the revenue or savings attributed to each project.
Template prompt: "Build a project and department ROI dashboard from our ledger records. Show total spend, revenue attributed, and overall ROI as tiles, and one chart of spend against revenue for each project or department, ordered by ROI, with the ones that earn back their cost in one color and the ones that don't in another."
The metrics to put on a financial reporting dashboard
These 12 metrics cover the nine examples above. Match each dashboard to the two to four that answer its question, because a screen with 12 metrics makes the answer hard to find.
| Metric | What it tells you | How it's calculated |
|---|---|---|
| Total revenue | Money earned from sales | Sum of sales for the period |
| Gross margin | Share of revenue left after direct costs | (Revenue minus COGS) divided by revenue |
| Operating income | Profit from core operations | Gross profit minus operating expenses |
| Net profit | What remains after every cost and tax | Revenue minus all expenses, interest, and taxes |
| Cash in and cash out | Money received and paid | Receipts and payments for the period |
| Closing balance | Cash left at the end of the period | Opening balance plus cash in minus cash out |
| Budget variance | The gap between plan and spend | Spend minus budget, so a positive number is adverse |
| Current ratio | Ability to cover short-term obligations | Current assets divided by current liabilities |
| Debt-to-equity | How much financing comes from debt | Total debt divided by shareholders' equity |
| ROI | Return for each dollar invested | Investment gain divided by investment base |
| Return on assets | Profit earned from what the business owns | Net profit divided by total assets |
| Return on equity | Profit earned for the owners | Net profit divided by shareholders' equity |
The three components every financial reporting dashboard needs
Visual summaries
KPI tiles, trend lines, and variance bars let a reader tell in seconds whether a number is good or bad. Each tile pairs a value with a comparison, such as last month or budget.
Date-range filters
Finance questions are almost always about a period. The dashboard needs a filter for month, quarter, year-to-date, and trailing 12 months. One filter should drive every chart, so the numbers always describe the same dates.
A live connection to the accounting system
A dashboard fed by a monthly export goes out of date as soon as someone enters a correction in the books.
A connection to QuickBooks, Xero, or Stripe keeps the numbers matching the books. Power BI has no built-in QuickBooks Online or Xero connector, so teams add a third-party connector or work from exports. Step 3 below shows how to connect each one in Zite.
Where to build it: Excel, a BI tool, or Zite
You can build a financial reporting dashboard in a spreadsheet, a business intelligence tool, or an app builder. The right one depends on who builds it, who reads it, and how fast the data changes.
| Excel | BI tool (Power BI, Qlik) | Zite | |
|---|---|---|---|
| Best for | One analyst's monthly review | Analyst teams combining many systems | Finance leads who want a shared dashboard from a prompt |
| Data connection | Imports files and sources through Data > Get Data | Connectors plus scheduled refresh | QuickBooks, Xero, Stripe, Google Sheets, Airtable, and Notion, plus Excel and CSV file import |
| Filters | Slicers and timelines | Interactive filters and drill-down | Filters generated from your prompt |
| Skill needed | PivotTable comfort | An analyst to model the data | Plain-language prompts |
| Sharing | Send or host the workbook | Published reports | A sign-in for each person, with unlimited users and no per-seat pricing |
| Cost to start | Included with Microsoft 365 | Varies by tool | Free plan, then $25/month |
Zite fits when finance leads share the dashboard by sign-in and build it from a plain-language prompt.
It reads from your accounting system and leaves the books where they are. Because it's an app rather than a report, the same screen can also act on what the numbers show: department heads update their budgets, and whoever chases receivables opens an overdue invoice and records the payment, which goes straight into QuickBooks or Xero.
For more tools that build dashboards, see this roundup of custom dashboard software.
What works and what falls short
- One view: Revenue, cash, and budget sit together, so the monthly review starts from the same screen every time.
- Faster follow-ups: A date filter answers "what about last quarter?" without a new export.
- Shared definitions: Everyone reads the same formula for gross margin or closing balance.
- Clean books needed: A transaction filed under the wrong category produces a wrong chart.
- Conflicting formulas: Two dashboards can calculate the same metric differently unless the formula is written down.
- Access control: Payroll and margin figures shouldn't reach everyone with a sign-in.
How to build a financial reporting dashboard in 6 steps
These steps work in any tool. The Zite version is noted where it differs.
Step 1: Write the one question
Start with a question the dashboard has to answer, such as "Are we on budget this month?" or "Which invoices are overdue?" One question per dashboard keeps the layout focused.
Step 2: Pick the metrics
Choose two to four metrics from the table above that answer the question. A budget question needs budget variance and the spend behind it. A cash question needs money in, money out, and the closing balance.
Step 3: Connect the data
Pick the source that holds your numbers. Zite lists these on its integration pages.
| Source | What Zite reads | How you connect |
|---|---|---|
| QuickBooks Online | Customers, vendors, accounts, invoices, bills, and payments | Sign in with Intuit, then approve accounting access. QuickBooks Desktop isn't supported. |
| Xero | Contacts, invoices, payments, bank transactions, and Profit and Loss and Balance Sheet reports | Create your own Xero web app, then add its Client ID and Secret in Zite |
| Stripe | Charges, subscriptions, customers, and invoices | Authenticate with your Stripe account |
| Google Sheets, Airtable, or Notion | The ledger or budget data you already keep there | Connect the sheet, base, or database so the dashboard reads it in place |
| Bank feed, Excel, CSV, or ledger export | Rows from a CSV or Excel file | Upload the file and re-import to refresh, or use Xero's bank transactions |
Connected sources (QuickBooks, Xero, Stripe, Google Sheets, Airtable, and Notion) stay current as the books change. A CSV or Excel file is a one-time import, so re-import it each period or switch to a connected source. Records you import count toward your plan's record limit.
The import guide also lets you review field names and types before you confirm.
Step 4: Shape the data
Give each record a date, an account or category, and an amount. Add a department if you report budget variance.
A busy ledger can use up the Free plan's 5,000 records. The Pro plan holds 100,000 records and costs $25/month.
Step 5: Describe the dashboard
In Zite, you describe the dashboard in plain language, the way an AI dashboard generator works. Here's a template prompt for a profit and loss view.
“Build a profit and loss dashboard from our ledger records. Show KPI tiles for revenue, gross margin, operating income, and net profit, a monthly trend line, and a table of expense categories with change from last month. Add date filters for the current month, the quarter, the year so far, and the last 12 months.”
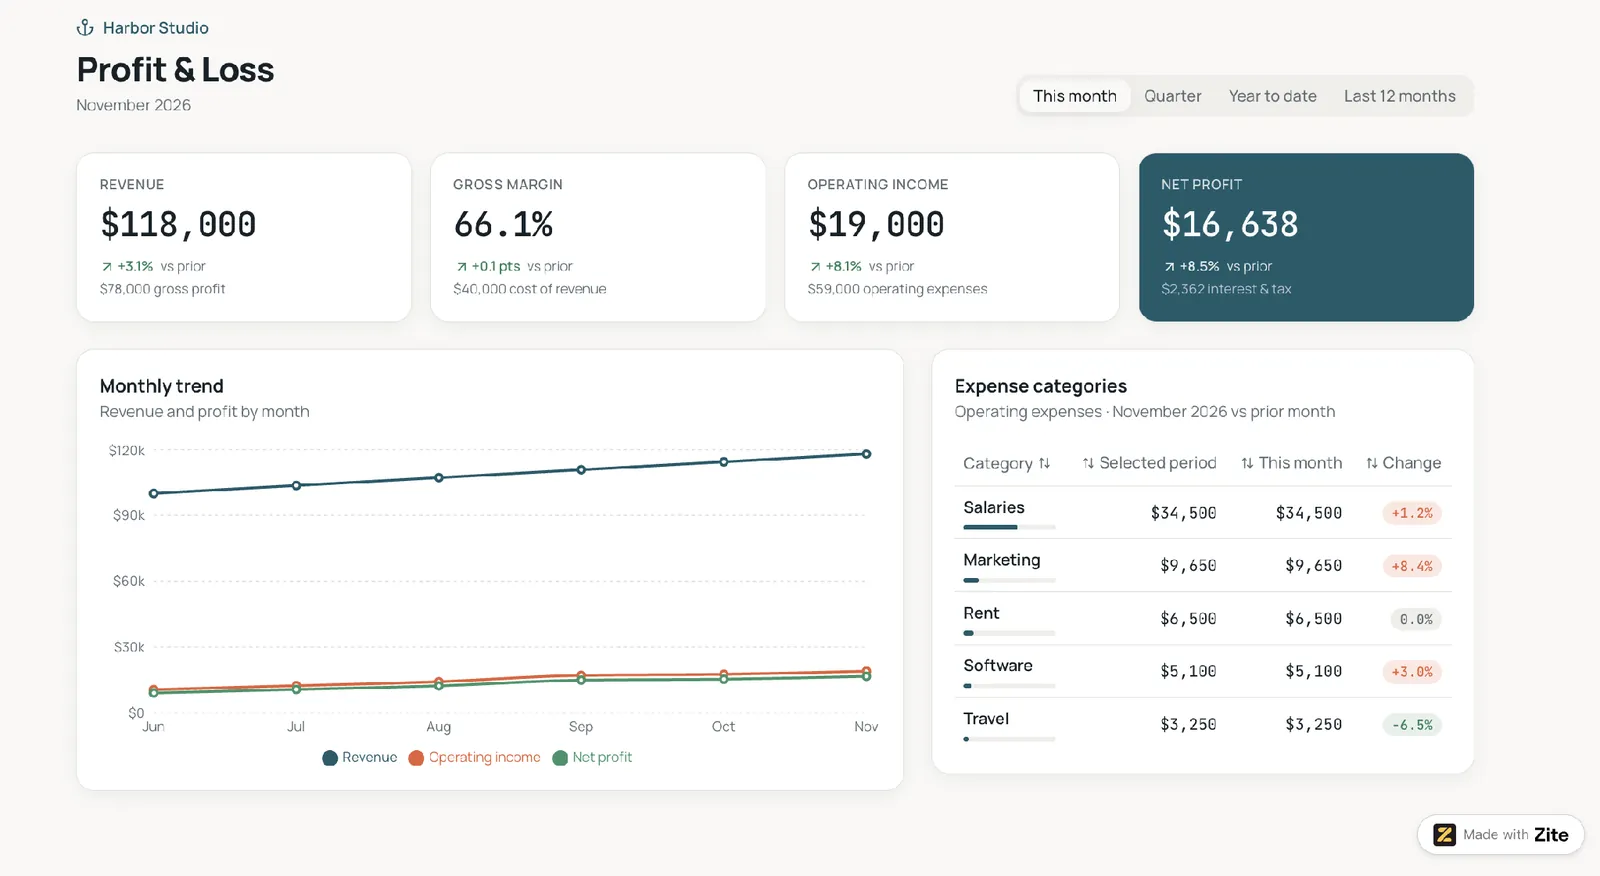
Compare every tile against the matching report in your accounting system before you share it.
Zite shows the workflow behind the dashboard as a flowchart you can inspect and trace. This helps you find where a wrong number comes from.
Step 6: Add filters and share
Confirm that each of the four date filters changes every chart. Then decide who sees what before you share the dashboard.
Here are three roles to plan for:
| Role | What they do | What they see |
|---|---|---|
| Administrator | Manages the connection and who has access | Every page and number |
| Finance manager | Enters transactions and adjusts budgets | Every report |
| Analyst | Reviews the numbers | Reports, view only |
Zite's QuickBooks help page says app visitors don't need their own QuickBooks logins. The app uses the one company you authorize.
That setup suits dashboards for your own team.
On any plan, you can describe who sees what, such as "analysts can view reports but not edit budgets, and only administrators see payroll," and Zite builds those roles into the app. The Team plan lets you define roles once for the whole workspace and reuse them across your apps. Before you share, open the dashboard as someone in each role and check what they see.
Before you launch, ask two colleagues to check the numbers against the accounting reports. After that, review the dashboard once a month so every tile stays current after a change to your chart of accounts.
Should you build one? My take
A financial reporting dashboard pays off when the same questions come up every month, and the answers live in an accounting system.
A dashboard shows what the ledger holds, so books that are months behind give it little to report.
A financial reporting dashboard is perfect for
Here are three groups that gain the most:
-
Finance leads and owners on QuickBooks or Xero who review the same reports every month.
-
Bookkeeping and accounting firms that send monthly reports to their own team or partners, much like a marketing agency client dashboard.
-
Teams that have outgrown a shared spreadsheet and want everyone reading the same numbers.
Skip it if you
Here are two signs to wait:
-
You need audited statements or consolidation across several legal entities, where your accounting software or a BI tool is a better fit.
-
You haven't reconciled the books recently.
Best practices and common mistakes
Here are three habits to build:
-
Write each formula once: Define gross margin, closing balance, and variance in one place and reuse them on every page.
-
Check against the books: Reconcile each tile to an accounting report before the dashboard goes live.
-
Share a view per audience: Give the board or your team a trimmed view, as this guide to a no-code client dashboard describes.
Here are two mistakes to avoid:
-
Too many tiles: A screen with 20 numbers has no clear question, so cut anything the decision doesn't need.
-
Mixed bases: Putting cash-basis and accrual-basis figures on one chart makes the totals match neither report.
My verdict on the financial reporting dashboard
A financial reporting dashboard is worth building when it answers a recurring question faster than an export does. Start with the executive summary and cash flow views, since they answer the questions owners ask first. Add budget variance once someone owns the budget.
Excel is the quickest start for one analyst. A BI tool is the stronger choice for deep analysis across many systems.
For a first build from QuickBooks, Xero, or Stripe data that several people can read, Zite builds the dashboard from a prompt and shows the workflow behind each number, so a wrong tile is easy to trace. The Free plan lets you try the prompt above at no cost.
Ready to build your financial reporting dashboard?
Zite's Free plan includes 50 credits a month, 10 messages a day, and room for 5,000 records, so you can build a first dashboard and test it with your finance team before you pay anything.
Frequently asked questions
What are the four types of dashboards?
The four types of dashboards are operational, strategic, analytical, and tactical, according to Klipfolio's guide. In my own mapping, an executive summary is strategic, receivables aging is operational, and a budget variance drill-down is analytical.
Can Excel build a financial reporting dashboard?
Yes, Excel can build a financial reporting dashboard with PivotTables, PivotCharts, and slicers, using data imported from a ledger export. It suits one analyst's monthly review, since sharing means sending or hosting the workbook.
How do you build a financial dashboard in Excel?
Build a financial dashboard in Excel by importing your ledger with Data > Get Data, as Microsoft's Power Query guide shows. Add a PivotTable and PivotChart, then slicers for dates.
What does a financial dashboard look like?
A financial dashboard looks like a single page with KPI tiles for revenue, profit, and cash across the top. Below them are a trend line for the period, a budget variance bar chart, and a detail table, with date filters along one edge.
What is the best tool to build a financial reporting dashboard?
The best tool to build a financial reporting dashboard for a team is one that connects to your accounting system and lets everyone read the same numbers, such as Zite. Excel suits one analyst's monthly review, and a BI tool such as Power BI or Qlik suits deep analysis across many systems.