
A Google Sheets dashboard comes down to two tabs that never touch: a raw data tab nobody edits directly, and a dashboard tab built entirely from summaries of it. Skip that separation, and the dashboard usually breaks within a week.
Here's the four-step build, the interactive controls worth knowing by name, and what Gemini in Sheets can now do to speed the build up.
What you'll need before starting
Prerequisites:
- A Google Sheet with the raw data you want to visualize.
- Basic comfort with pivot tables or the QUERY function (covered below either way).
- No paid add-on required.
Time required: 20 to 30 minutes for a basic dashboard, 45 minutes to an hour with interactive filters added.
Free template: Copy this dashboard template to start from a working example instead of a blank sheet, with the raw-data-plus-summary-tables structure already built.
How to create a dashboard in Google Sheets: step-by-step
Step 1: Keep raw data on its own tab, completely separate from the dashboard
Start by cleaning the raw data itself. Run Data > Data cleanup > Remove duplicates to clear duplicate rows, and fix any column with a mixed date or number format, since either one throws off a chart before anyone notices.
Then move that data to its own tab, ideally just named "Data," and don't touch it again except to add new rows. Your summary tables pull from this tab, and your charts pull from the summary tables. Nothing ever writes back into the Data tab.
This is the first thing I check on a dashboard that stops updating correctly, and it's the mistake that ruins first-time dashboards fastest. Chart a messy raw tab directly, and the moment someone sorts a column or adds a row in the wrong place, every chart built on it fails.
Step 2: Build summary tables with QUERY or pivot tables
Charts should never reference raw data directly. Build a summary table first, either with a pivot table (Insert > Pivot table) or a QUERY formula, then chart that summary instead.
A QUERY example that sums revenue by rep, using the free template's Data tab (change the letters to match your own sheet):
=QUERY(Data!A:E, "SELECT B, SUM(E) WHERE A IS NOT NULL GROUP BY B LABEL SUM(E) 'Total'")
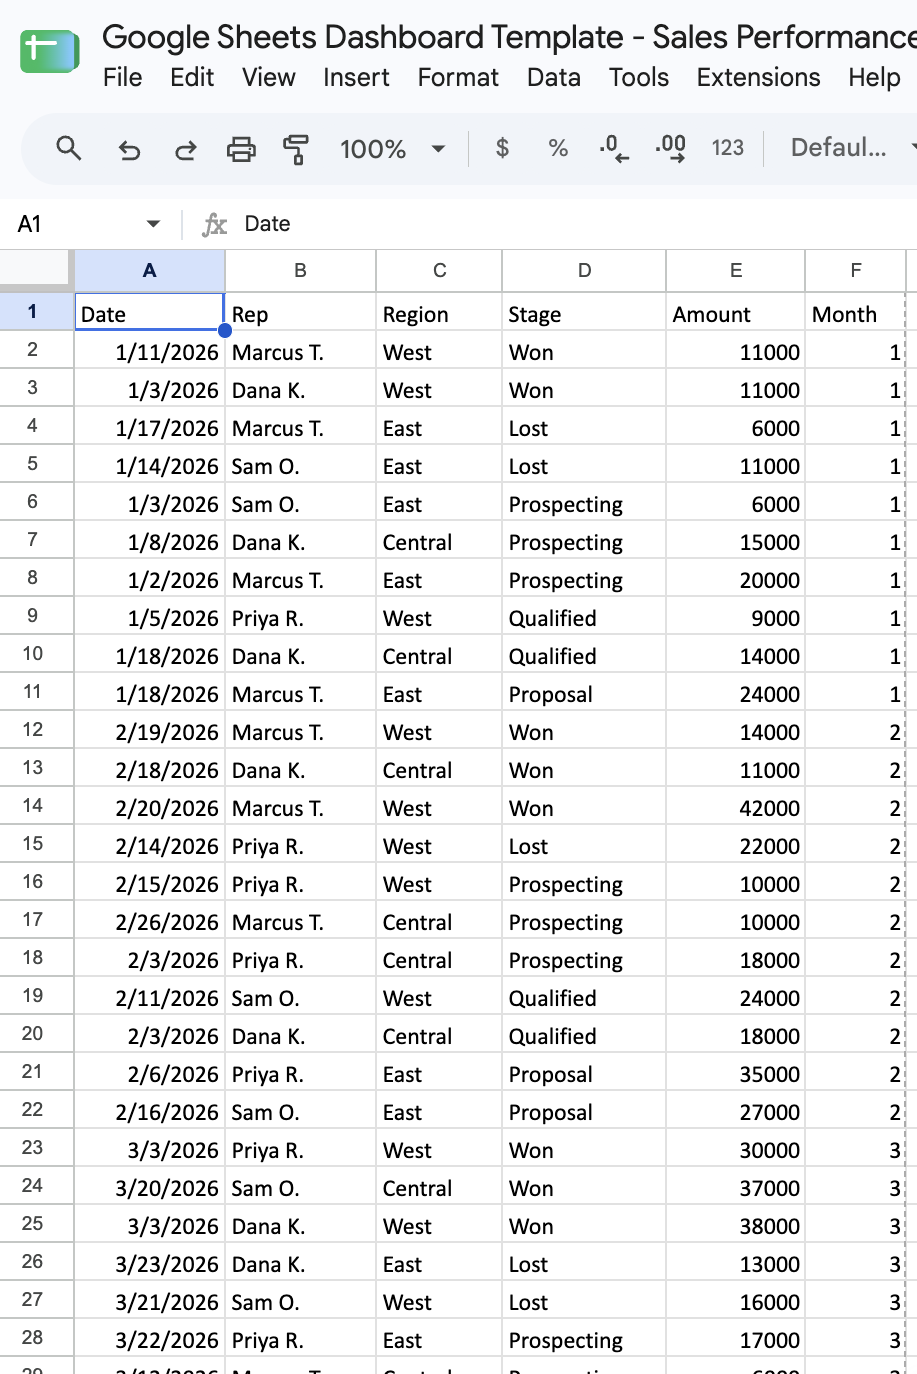
Pro tip: Pivot tables are faster to set up. QUERY formulas handle new rows better, since a pivot table built on a fixed range has to have that range widened by hand.
Step 3: Choose the right chart type for each metric
Match the chart to the shape of the number itself, not to which one looks most impressive on the page.
Here's how to match each metric to its chart:
- A trend over time (revenue by month, signups by week) → line chart.
- A comparison across categories (sales by rep, tickets by team) → bar chart.
- A single important number (total revenue, active users) → a scorecard chart, Sheets' built-in big-number display.
- A breakdown of parts to a whole (revenue by channel) → a stacked bar chart. Skip the pie chart, since it gets hard to read past four or five slices.
- A regional breakdown (revenue by state, signups by country) → a geo chart, plotting values directly onto a map instead of a bar per region.
- A trend that needs to sit inside a table row (each rep's monthly revenue, glanced at without opening a separate chart) → a sparkline, built with the =SPARKLINE() function for a miniature chart inside a single cell.
Step 4: Lay out the new dashboard tab
Create a new tab named "Dashboard." Insert each chart here via Insert > Chart, selecting data from your summary tables, never the raw data tab directly.
Put the most important number at the top, like a total revenue scorecard, with supporting detail charts below it. A dashboard someone has to scroll through to find the headline number defeats the point of building one.
Interactive controls worth knowing by name
Slicers filter every chart and pivot table on a sheet that references the filtered range, without touching the underlying data. Add one through Data > Add a slicer, then pick the column to filter by.
Filter views let one person apply a filter without changing what anyone else sees, unlike a basic filter that changes the view for everyone with the sheet open. Create one through Data > Filter views > Create new filter view.
Dropdowns through data validation let a viewer pick an option, like a specific region or rep, that a formula or QUERY elsewhere on the dashboard references. Set one up through Data > Data validation, with "Dropdown" as the criteria.
Dynamic chart ranges update automatically as new rows get added, usually by referencing a full column (like Data!A:D) instead of a fixed range (like Data!A2:D50) in the underlying summary formula.
Build a dashboard faster with Gemini in Sheets and Sheets canvas
Gemini in Sheets, accessible through a side panel, can generate charts, summary formulas, and full data summaries from a plain-language description instead of building each piece manually.
It can also pull data in from another file without leaving the sheet. Reference that file with an @ mention in the prompt, and Gemini imports and summarizes it alongside what's already there.
A Sheets canvas turns a prompt into a full interactive dashboard, a Kanban board, or a calendar view instead of a single chart, and you can add, edit, or delete data right inside the canvas, which writes back to the sheet.
Open a sheet, then select "Create canvas" from the Tools menu, the Insert menu, or the Canvas menu at the bottom. Describe what to build, something like "create a dashboard tracking revenue by month and by rep," and Gemini lays out the visuals from there.
The feature needs an eligible Workspace or Google AI plan, an English-language account, a native Google Sheet under 1 million cells, and a desktop browser.
Google started rolling it out in August 2026. Google updates both tools often, so check Google's Workspace help page if a menu has moved.
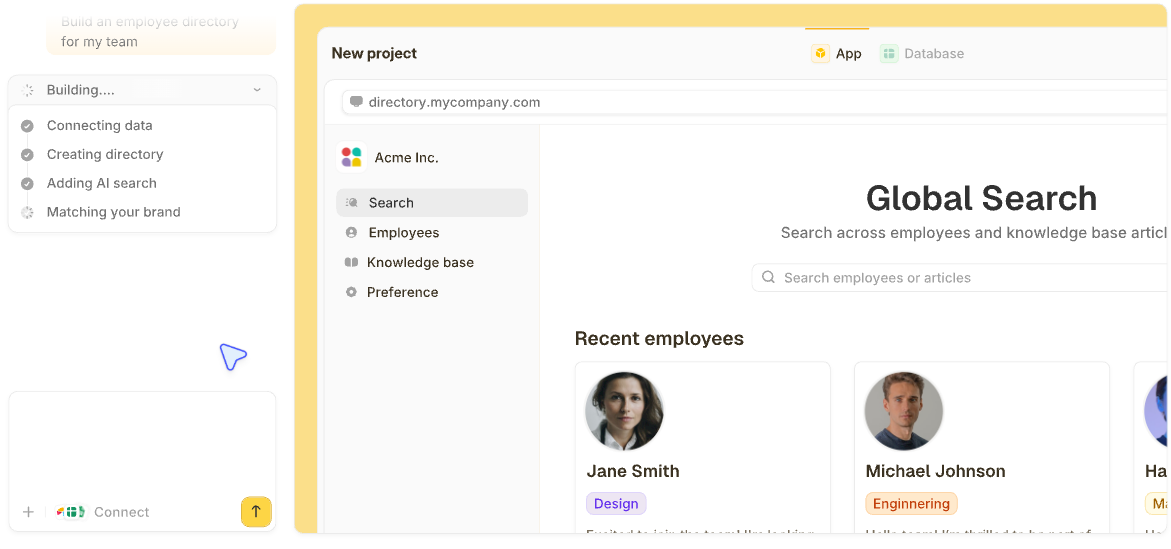
When the dashboard needs to live outside a spreadsheet, tell Zite what you need, and it builds the dashboard and its database, plus whatever else the team works from on the same data, such as a form that feeds it or a view for each rep.
This walkthrough on generating a dashboard with AI shows the process, and you can also start from a template and customize it.
3 example dashboards worth building from
A sales performance dashboard: a revenue trend line by month, a pipeline-by-stage bar chart, and a win-rate scorecard at the top. If the deals aren't in a sheet yet, start with this sales tracker in Google Sheets.
A marketing campaign dashboard: traffic by channel as a bar chart, a conversion funnel from visit to signup built as a bar per stage, and total spend against results as a scorecard pair.
A team operations dashboard: open tasks by status as a bar chart, workload by team member, and an overdue-items count flagged in a scorecard, close to the layout in this operations dashboard template.
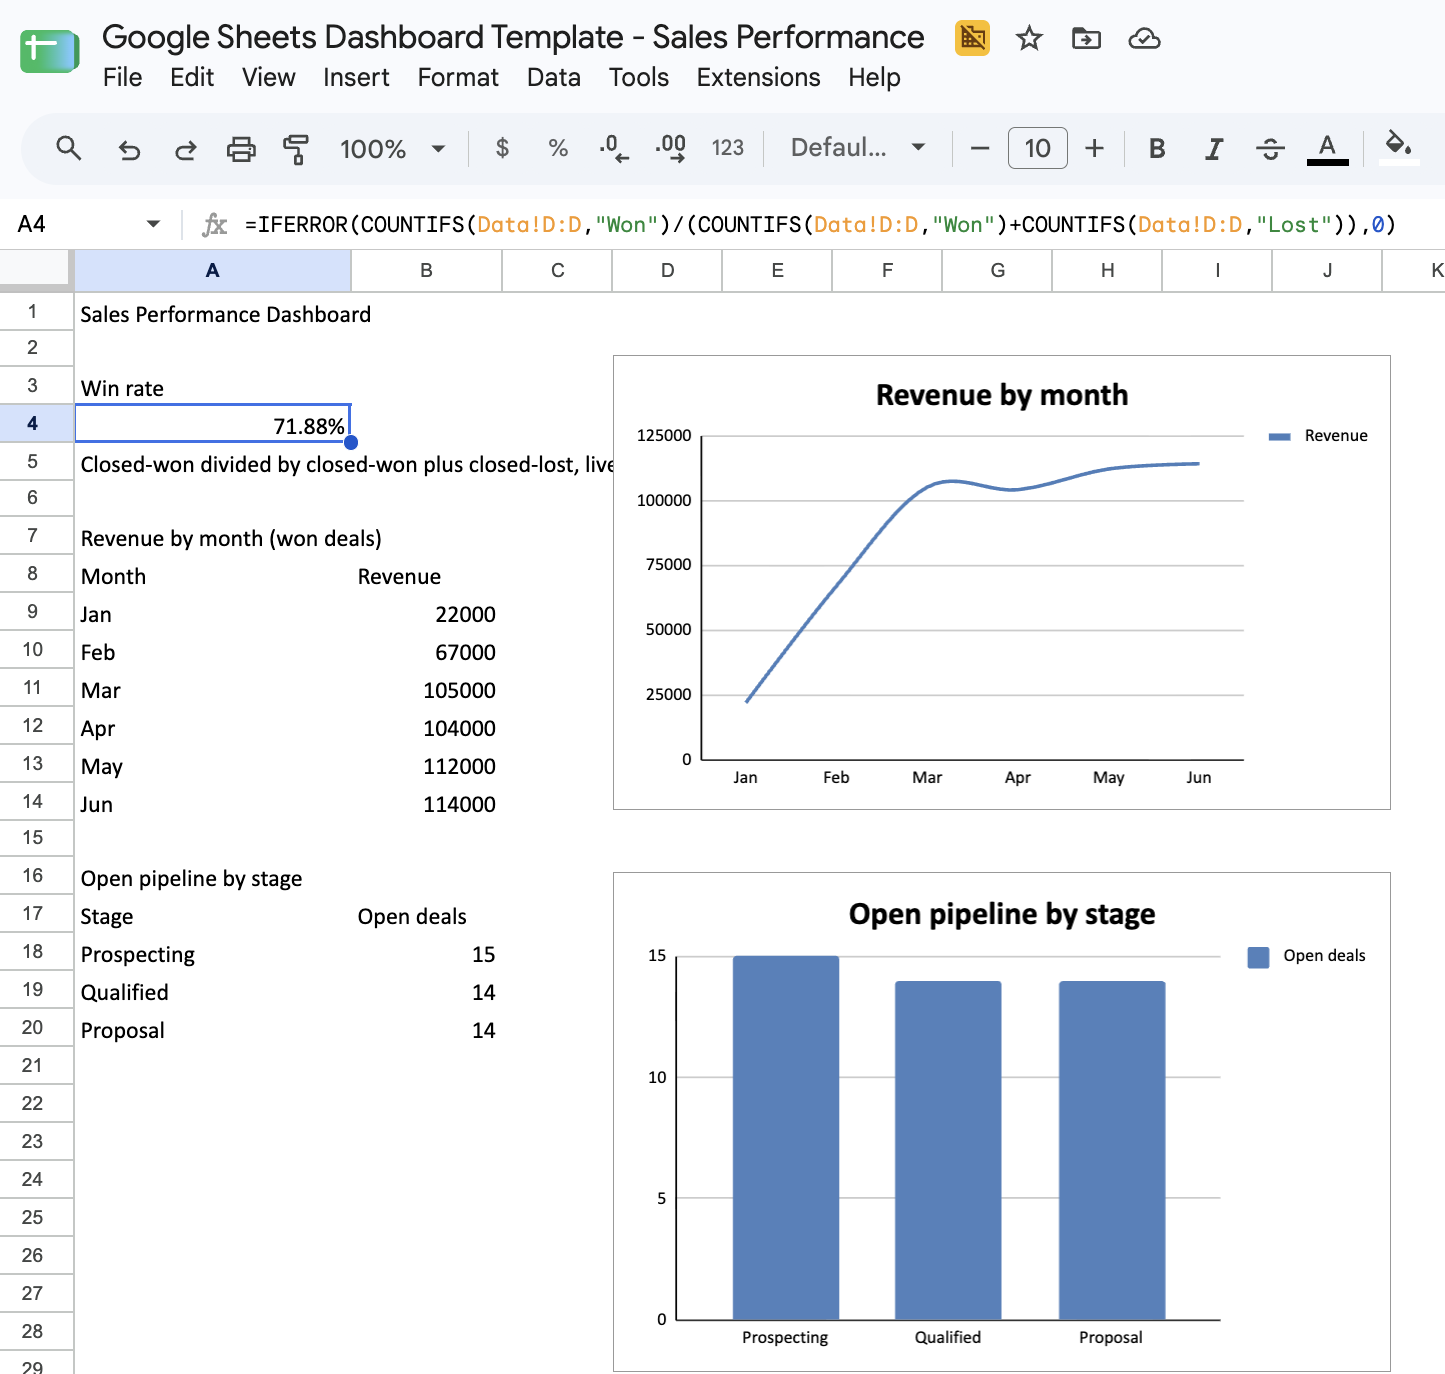
Copy this dashboard template to skip straight to a working sales performance dashboard, built on the same raw-data-plus-summary-tables structure this guide walks through.
The template's raw data already includes a region column, so a geo chart summarizing revenue by region is a natural next addition once the base three charts are in place.
Common mistakes to avoid
These four mistakes wreck a dashboard fastest:
- Charting raw data directly: This skips the summary-table step and leaves every chart fragile to a sorted column or an added row.
- Too many charts on one tab: Fifteen charts crammed onto a single tab turn the dashboard into a report nobody reads in full.
- Fixed chart ranges that stop growing: A range like A2:A50 stops updating once row 51 gets added.
- No scorecard for the one number that matters most: If the headline metric sits buried inside a detail chart, someone has to hunt for it every time.
What a Google Sheets dashboard can't do
A Sheets dashboard works well for one person checking their own numbers, but the limits show up fast. Numbers from your other tools don't flow in automatically, so someone has to paste or import them, and a sheet with dozens of charts starts to lag.
Charts can also show wrong numbers after someone sorts or deletes a row. And you can't give each viewer a view of only their own data, the way a no-code client dashboard can.
For more on choosing between a spreadsheet and a dedicated tool, this guide to Google Sheets alternatives for business databases covers it directly.
Zite handles what a Sheets dashboard can't
Zite builds the same kind of dashboard from a plain-language description, plus everything that comes with it. The data sits in a database that edits like a spreadsheet, but sorting a column only changes the order, and the Business plan holds up to 250,000 records.
The dashboard, the form that feeds it, the team tracker, and the client-facing view all read the same records, so there's one version of the numbers, and a User field limits each person to their own records.
What Zite adds once a Google Sheets dashboard reaches those limits:
- Generate it from a description: Say what the dashboard should show and who looks at it, and Zite builds the charts, the summary views, and the database together.
- Keep the spreadsheet you already have: Connect your Google Sheet and the app reads and writes its rows, or import a copy of the data into Zite's own database if you'd rather leave the spreadsheet behind.
- One set of records, always current: Every view reads the same records, so an edit in one place shows up in all of them, with no refresh step and no copies drifting apart.
- Each person sees their own view: Add a User field to a table and ask Zite to limit what each person sees, so a rep sees their own numbers and a client sees only their account, all from the same dashboard.
- AI fields: Write an instruction for a column, and Zite fills it in for every record, such as sorting each one into a category or summarizing a long note.
- Unlimited users: Every plan includes unlimited users, so adding teammates or clients never changes the price.
Creating a dashboard in Google Sheets is the right place to start. When it outgrows the sheet, Zite builds the next version fast and keeps every workflow visible, so you still understand how it works.
Start building with Zite for free.
Frequently asked questions
Does Google have a dashboard tool?
Yes. Google Sheets is Google's dashboard tool for most people, through charts, pivot tables, and slicers. Data Studio is Google's separate business intelligence tool, built for reporting across more data sources than a single spreadsheet handles.
How do I build a Google dashboard?
Build a Google dashboard by keeping raw data on its own tab, summarizing it with QUERY or pivot tables, choosing chart types that match each metric, and laying the finished charts out on a dedicated dashboard tab.
How do I make a dashboard in a spreadsheet?
A dashboard in any spreadsheet comes together the same way: keep the raw data on its own tab, build summary tables from it, and chart those summaries. That holds in Google Sheets, Excel, or any other spreadsheet.
Can ChatGPT create a dashboard?
Yes, with the ChatGPT for Google Sheets add-on. It runs in a sidebar inside your sheet, and you can ask it in plain language to build, update, or explain the spreadsheet behind your dashboard. It works on free ChatGPT accounts too, and you should check what it changed before you share the dashboard.
Can Zite help me build a dashboard?
Yes. Zite builds a dashboard from a plain-language description, on a database that holds up to 250,000 records on Business. Your Google Sheet can stay connected, and each person sees only their own records. This roundup of custom dashboard software compares Zite against the wider field once a spreadsheet stops being enough.